Table of Contents
Key Takeaways
- Modern water quality sensors increasingly ship with on-board self-diagnostics — electrode impedance monitoring, reference-drift detection, signal-integrity checks, and automated temperature compensation — that give operators early warning of fouling, aging, and calibration drift.
- Predictive maintenance (PdM) programs built on these diagnostics can reduce equipment-failure downtime by 30–50% and maintenance costs by 10–40%, according to McKinsey Global Institute analysis of asset-intensive industries (MGI, The Age of Analytics).
- Continuous online monitoring detects transient events — turbidity spikes, disinfectant residual loss, conductivity excursions — that periodic manual grab samples routinely miss, supporting faster compliance response (effluent monitoring guidance).
- Edge processing of sensor data enables near-real-time anomaly response while substantially reducing the data volume that must be transmitted to central platforms.
- The global water quality monitoring market is estimated at roughly USD 5–6 billion in 2025 and is projected to grow at a high-single-digit CAGR through the mid-2030s (MarketsandMarkets; Fortune Business Insights).
Introduction
In modern industrial water and wastewater treatment, sensor reliability and measurement accuracy directly affect process control, compliance, and product quality. The traditional maintenance model — repairing after failure, or servicing on a fixed calendar — has well-known limits: it either allows instruments to drift unnoticed between visits or over-maintains healthy equipment.
The global water quality monitoring market is estimated at roughly USD 5–6 billion in 2025 and is projected to grow steadily, driven by tightening discharge regulations, smart-water investment, and the integration of IoT, cloud analytics, and artificial intelligence into monitoring networks (MarketsandMarkets; Fortune Business Insights). Within that shift, self-diagnostics and predictive maintenance have become central to extracting reliable performance from online water quality instruments.
This article explains how these technologies work and what performance benefits operators can realistically expect — grounded in published industry benchmarks rather than unverified claims.
1. How Self-Diagnostics Work
Sensor self-diagnostics give an instrument the ability to monitor its own health and flag degradation before it compromises measurement:
Sensor health monitoring
– Electrode impedance monitoring tracks the condition of pH/ORP electrode surfaces, identifying fouling, coating, or aging trends.
– Reference electrode drift detection watches the reference potential for instability that signals junction contamination or electrolyte depletion.
– Membrane integrity checks (for electrochemical sensors) detect reduced permeability.
Signal integrity analysis
– Noise-level monitoring flags electromagnetic interference or failing electronics.
– Signal-stability evaluation recognizes abnormal fluctuation patterns that often precede failure.
– Data-quality scoring helps operators distinguish trustworthy readings from suspect ones.
Environmental compensation
– Automatic temperature compensation corrects measurement bias across process temperature swings.
– Pressure and flow compensation models reduce error in demanding installation conditions.
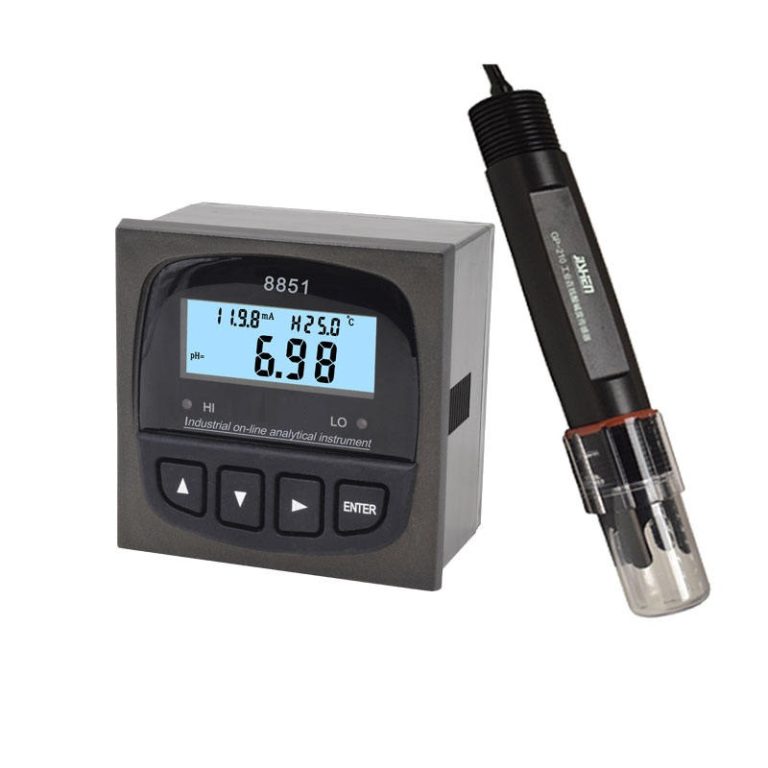
Shanghai ChiMay’s online water quality analyzers incorporate multi-point health checks — electrode condition, calibration status, temperature, and signal quality — so that maintenance can be triggered by instrument condition rather than by a fixed schedule.
2. Predictive Maintenance Algorithms and Evidence
Predictive maintenance uses historical and real-time sensor data, processed with machine learning, to forecast future instrument condition. Common approaches include time-series forecasting of drift and calibration intervals, and anomaly detection that flags departures from learned normal behavior.
The most widely cited cross-industry benchmarks come from the McKinsey Global Institute, which reviewed industrial analytics deployments and found that predictive maintenance delivers:
- 30–50% reduction in downtime from equipment failures
- 10–40% reduction in maintenance costs
- 3–5% increase in useful equipment life
(MGI, The Age of Analytics: Competing in a Data-Driven World)
McKinsey’s subsequent operations research emphasizes that results depend on maturity: low-maturity threshold-alarm systems capture only a fraction of the benefit, while high-maturity programs that combine good data history, sufficient sensor coverage, and validated models can prevent a large share of failures before they occur (McKinsey Operations).
The water sector is demonstrating the same trajectory. Singapore’s national water agency PUB deployed self-learning predictive control at its water reclamation plants; the system predicted influent load several days ahead, supported unattended operation, and achieved aeration flow reductions of up to 15% with corresponding energy savings while maintaining stable effluent quality (Royal HaskoningDHV / PUB). In 2026, PUB also moved toward “cognitive maintenance” — AI that diagnoses root causes and prescribes corrective action on critical rotating equipment (Groundup.ai / PUB tender).
A typical Shanghai ChiMay predictive-maintenance workflow:
- Early warning of electrode aging or fouling, days in advance, from diagnostic trends;
- Automatic generation of a maintenance work order for the operations team;
- Spare-parts and replacement planning before the scheduled intervention;
- Maintenance executed in a planned window, with sensor replacement or cleaning;
- Post-service calibration verification and automatic return to service.
3. Measurement Accuracy and Drift Management
Sensor drift is the main enemy of measurement accuracy. Online instruments address it through three layers: automatic temperature compensation to remove environmental bias; stable sensor chemistries (such as optical luminescent dissolved oxygen, which requires no membrane or electrolyte and resists fouling in low-flow and sulfide-rich water); and calibration scheduling driven by diagnostic condition rather than a fixed calendar.
Continuous monitoring itself has a compliance value that manual sampling cannot match. Under the U.S. Clean Water Act’s NPDES program, civil penalties for permit violations can exceed USD 60,000 per day, and regulators increasingly treat time-stamped continuous records as the only defensible evidence — manual grab samples leave operators blind to transient load spikes between visits (effluent compliance guide).
4. System Architecture: Edge and Cloud
Predictive maintenance requires real-time processing close to the source. Edge gateways collect data from online analyzers over standard industrial protocols (Modbus RTU/TCP, 4–20 mA/HART, MQTT, OPC UA), run local anomaly detection and alarming, and forward only summarized or exception-based data to the cloud — reducing latency for critical events and lowering bandwidth requirements. The cloud layer handles time-series storage, model training, visualization, and work-order integration, with updated models pushed back to edge devices.
5. Maintenance Model Comparison
| Maintenance Model | How It Works | Strengths | Limitations |
|---|---|---|---|
| Reactive (run-to-failure) | Repair after the sensor fails | Lowest planned effort | Highest unplanned downtime and compliance risk |
| Preventive (calendar-based) | Service and calibrate on fixed intervals | Predictable scheduling | Over-maintains healthy instruments; misses between-visit failures |
| Predictive (condition-based) | Diagnostics + analytics trigger maintenance on actual condition | Downtime reduced 30–50%, maintenance cost reduced 10–40% (MGI) | Requires data history, sensor coverage, and validated models |
6. Deployment Path
Phase 1 — Data foundation (1–3 months): deploy online analyzers and establish edge data collection; begin building operating history.
Phase 2 — Baseline and model development (3–6 months): establish normal-behavior baselines, tune drift and anomaly thresholds, and integrate alarms into the maintenance workflow.
Phase 3 — Predictive operation (ongoing): run condition-based maintenance, validate predictions against outcomes, and refine models continuously.
Conclusion
Self-diagnostics and predictive maintenance do not produce a single magical “percentage improvement” — they produce a measurable, evidence-backed shift from reactive to condition-based operation. Published cross-industry benchmarks show 30–50% less unplanned downtime and 10–40% lower maintenance costs from mature predictive programs; water-sector deployments such as PUB’s demonstrate double-digit energy savings from advanced analytics; and continuous online monitoring protects against compliance penalties that manual sampling cannot prevent.
Shanghai ChiMay’s intelligent water quality sensors and analyzers integrate on-board diagnostics, automated compensation, and standard industrial connectivity, giving treatment plants the data foundation needed to move from calendar-based maintenance toward genuinely predictive operation — improving reliability, measurement confidence, and operating efficiency.
Sources
- McKinsey Global Institute — The Age of Analytics: Competing in a Data-Driven World (predictive maintenance benchmarks): https://barnummechanical.com/wp-content/uploads/2024/01/Predictive-Maintenance.pdf
- McKinsey Operations — A smarter way to digitize maintenance and reliability: https://www.mckinsey.com/pl/en/~/media/McKinsey/Business%20Functions/Operations/Our%20Insights/A%20smarter%20way%20to%20digitize%20maintenance%20and%20reliability/a-smarter-way-to-digitize-maintenance-and-reliability.pdf?shouldIndex=false
- MarketsandMarkets — Water Quality Monitoring Market: https://www.marketsandmarkets.com/Market-Reports/water-quality-monitoring-market-72412644.html
- Fortune Business Insights — Water Quality Monitoring Systems Market: https://www.fortunebusinessinsights.com/water-quality-monitoring-market-105753
- Royal HaskoningDHV / PUB — Aquasuite predictive control at Ulu Pandan: https://www.haskoning.com/en/twinn/impact-stories/pub-introduced-aqua-suite-to-provide-advanced-process-control-and-analytics
- Wizsensor — Industrial Wastewater & Effluent Monitoring: EPA Compliance: https://wizsensor.com/apps-water-quality-monitoring-for-industrial-effluents/