Board Briefing · Executive Decision-Maker Perspective · Published: October 9, 2026
Table of Contents
Key Takeaways
- Manual sampling costs several times more per monitoring point than an equivalent online point. That is a structural gap, not a rounding error — and the money hides in payroll, vehicles, laboratory invoices and the operations budget where excursions land [1].
- A single water-quality excursion is expensive once permit exposure, lost product and remediation are counted, and grab-sampling programs are structurally bad at catching the events that cause it [1].
- Laboratory-based testing bills per sample for labor plus analysis; amortized continuous monitoring lands at a fraction of that per sample-equivalent [2].
- In facilities that rely on manual testing, most chemical overdosing events trace directly to data latency — decisions made on measurements that were already old when they arrived [3].
- Automated online monitoring recovers its capital cost within a couple of years for most mid-size facilities, and the savings continue after that.
- The pragmatic architecture is hybrid: online instruments on critical points, manual rounds demoted to monthly verification — a shift that removes most of the sampling-related labor while keeping laboratory confirmation where it adds value [2].
The Decision in One Paragraph
Manual sampling rounds feel free because their costs are scattered across payroll, vehicles, laboratory invoices and the operations budget where excursions land. Consolidated, they are one of the most expensive per-data-point activities in a water-intensive plant — and the cheapest line item to restructure. The board-level question is not whether to fund online monitoring; it is how quickly the current sampling model converts labor and latency into avoidable loss.
Where the Money Actually Goes
A manual sampling round is a chain of cost events. An operator walks or drives a circuit, collects grab samples at each point, bottles and labels them, maintains chain of custody, transports them to a laboratory or shipping point, and later transcribes the returned results into the operating record. Each grab sample captures one moment at one location. The analysis that follows takes hours to days. And the process control decision that depends on the result is made on data that was already old when it arrived.
None of this is controversial as chemistry — the laboratory methods are excellent. The issue is arithmetic. Distribution-system monitoring today is still carried out predominantly through manual grab samples, and the practice is acknowledged in the engineering literature as labor-intensive by design [4]. Federal cost models budget operator time for recording and routine sampling at every instrument, every day [6] — time that scales linearly with point count while the value of each individual data point stays flat.
Then there is what the round cannot see. Between two visits, water quality can move substantially. Continuous instruments logging at intervals of minutes routinely capture contamination and process upsets that weekly or monthly grab sampling misses entirely. The missed event does not appear on any invoice, which is precisely why it stays invisible to a budget review.
The Cost Stack, Itemized
| Cost item | How to quantify it | What online monitoring changes |
|---|---|---|
| Operator hours per round | Crew size × points × minutes per point × rounds per day; federal cost models budget daily operator time per instrument for routine sampling [6] | Routine rounds eliminated; most of the sampling-related labor redeployed to verification and maintenance [2] |
| Laboratory analysis fees | Samples per year × per-sample cost of labor plus analysis [2] | Amortized sensor and system cost per sample-equivalent, a small fraction of the manual figure [2] |
| Travel, site access and chain of custody | Vehicle time, escorts, permits, transport and holding-time compliance | No transport and no holding-time exposure; data arrives with the measurement |
| Data latency losses | Hours between event and detection × hourly cost of off-spec product or overdosed chemical | Continuous trend data; the overdosing events attributed to latency become preventable [3] |
| Missed-event risk | Event probability × cost per excursion [1] | Continuous data catches events that grab rounds miss |
| Reporting and compliance overhead | Hours per report × reports per permit cycle | Automated records and audit-ready exports reduce assembly work |
Two items in that table deserve the board’s attention more than the rest, because they are the ones a facilities budget usually hides.
Labor Is the Visible Half
The labor line is straightforward to verify with a stopwatch. Multiply the sampling circuit by its frequency and by loaded hourly cost, and most plants find that the routine round consumes a surprising fraction of an operator’s shift. The published benchmarks all point the same way: manual sampling costs several times more per point per year than the online equivalent [1], and per-sample economics favor continuous monitoring by roughly an order of magnitude once sensor and system costs are amortized [2]. At fleet scale — every cooling loop, softener train and discharge point in a plant — the difference is a staffing decision, not an instrumentation decision.
Latency Is the Invisible Half
The labor line at least appears on payroll. Latency never does, which is why it dominates the true cost. In manually monitored facilities, most chemical overdosing events are directly attributable to decisions made on outdated measurements [3] — a mechanism any operations leader will recognize from their own incident logs. When the feedback signal arrives hours or days after the dose, the control loop runs open, and the plant pays in chemical, in energy, and occasionally in an excursion that carries permit exposure and remediation on top of the lost product [1]. Industry-wide, mid-size facilities running manual testing carry a large combined bill for labor, reagents and forgone optimization — the latent line item made visible [3].
The same latency arithmetic explains why continuous monitoring changes incident statistics rather than merely adding data. Sensors reporting at short intervals capture, timestamp and alarm the events that a weekly round would have smoothed over. Facilities that have made the switch report the same pattern: alarms arrive with the event instead of after it, chemical consumption falls once dosing can be trimmed against real time data, and compliance violations drop toward zero when the excursions are caught early enough to correct.
The Payback Logic
The investment case rests on three anchors. First, the structural cost gap per point: manual sampling costs several times what online monitoring costs each year for the same measurement [1]. Second, the payback window: online monitoring recovers its initial investment within roughly one to two years at most mid-size facilities, then returns ongoing savings in chemicals, labor and avoided excursions [3]. Third, the multiplier effect of frequency: a continuous instrument produces thousands of results a year where a weekly round produces dozens, and the marginal cost per additional reading is close to zero. Few line items in a plant budget offer a comparable, measurable return profile — and fewer still come with an audit trail that improves in the bargain.
A Hybrid Architecture Worth Funding
None of this argues for deleting the laboratory. It argues for repositioning it.
The architecture that survives scrutiny puts online analyzers on the points where latency or frequency carry economic weight — plant intakes, process-critical loops, discharge and reuse boundaries — and demotes manual rounds to a monthly verification role: cross-checking online results, calibrating against reference methods, and confirming regulatory parameters that require certified laboratory analysis. That hybrid keeps the laboratory’s authority where it is irreplaceable while removing the daily labor and the latency from the control loop. It is also the version of the project a CFO can approve with a straight face: no rip-and-replace, a defined point list, and a payback measured in months rather than years.
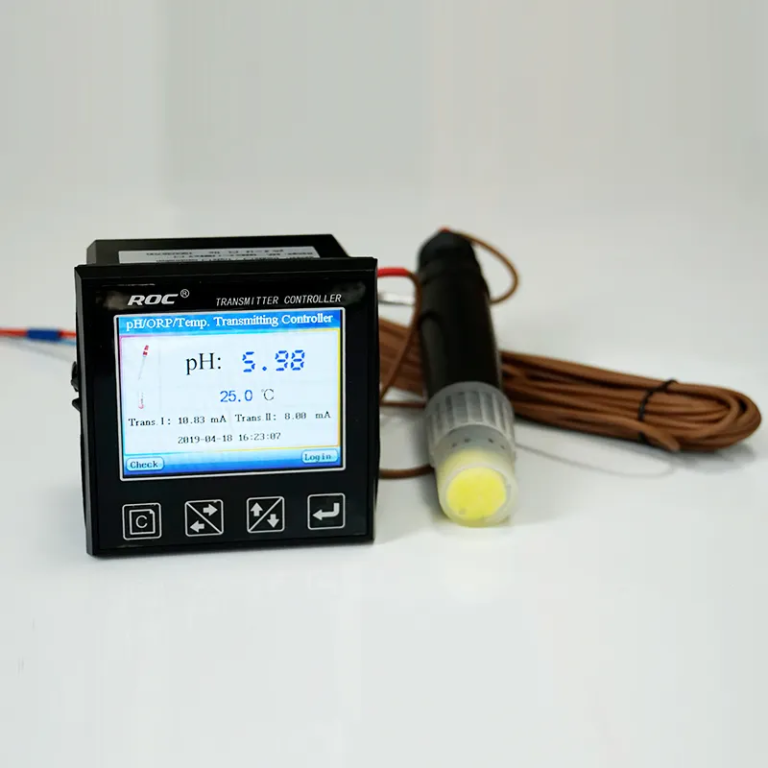
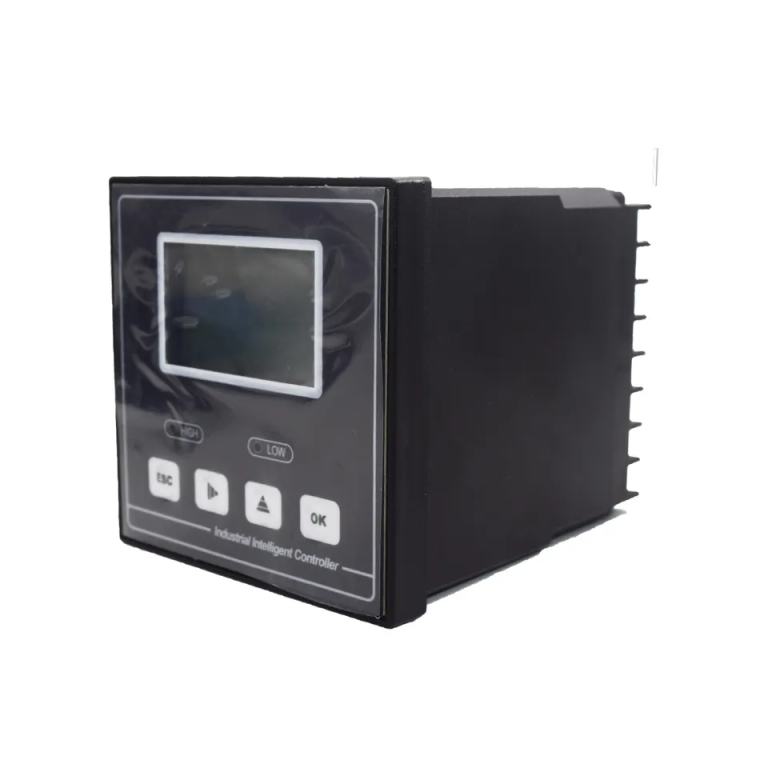
Shanghai ChiMay positions its analyzer line around exactly that outcome: buy the sensor, own the outcome; we quote five-year cost, not just unit price [6]. The five-year quotation is what makes the hybrid conversation concrete, because it forces the manual-round baseline and the online alternative onto the same ledger.
What to Ask Before the Next Budget Cycle
Four questions convert this briefing into a decision. How many points does the plant sample, at what frequency, and what does the loaded labor for that circuit cost? What did laboratory invoices total last year? What did the last water-quality excursion cost in chemical, downtime and remediation? And which of the currently sampled points would justify continuous data if the per-point cost dropped by half? The answers almost always fund the first phase of the online program by themselves.
The hidden cost of manual sampling is not hidden because it is complicated. It is hidden because it is distributed — and consolidation is precisely what online monitoring is for.
References
- Shanghai ChiMay — “Understanding the Cost-Benefit Analysis of Industrial Water Monitoring Systems” — Per-point annual cost comparison between manual sampling and online monitoring; excursion cost exposure; and the measured return on monitoring investment. https://www.chimaycorp.com/Understanding_the_Cost-Benefit_Analysis_of_Industrial_Water_Monitoring_Systems/641.html
- Shanghai ChiMay — “Can Water Quality Sensors Help Reduce Operational Costs?” — Sample-level cost comparison between manual laboratory testing and continuous monitoring, the reduction in sampling-related labor from routing routine rounds through online instruments, and case results including faster alert response and lower chemical consumption. https://www.chimaycorp.com/Can_Water_Quality_Sensors_Help_Reduce_Operational_Costs-/265.html
- Shanghai ChiMay — “The Hidden Cost of Manual Water Testing in Industrial Facilities” — Annual manual-testing cost at mid-size facilities, the share of overdosing events attributed to data latency, and the payback and ongoing savings from automated monitoring. https://shchimay.com/pt/the-hidden-cost-of-manual-water-testing-in-industr
- National Academies Press — Drinking Water Distribution Systems: Assessing and Reducing Risks (Chapter 9, monitoring) — Documents that routine distribution-system water quality monitoring is carried out predominantly through manual grab samples, a labor-intensive practice. https://www.nap.edu/read/11728/chapter/9
- Environmental XPRT — “Real-Time Water Quality Monitoring for Drinking Water Utilities” — Continuous sensing captures contamination risks that weekly or monthly grab sampling misses. https://www.environmental-expert.com/articles/real-time-water-quality-monitoring-for-drinking-water-utilities-1195849
- U.S. EPA — Work Breakdown Structure-Based Cost Model for Drinking Water Compliance (NSCEP) — Federal cost-model operator labor assumptions, including daily per-instrument time for recording operating parameters and routine sampling. https://nepis.epa.gov/Exe/ZyPURL.cgi?Dockey=P10154ME.TXT
About the author: Written by the Shanghai ChiMay Technical Editorial Team — the market-facing engineering group behind Shanghai ChiMay’s online water quality analyzer and multi-parameter sensor line, focused on monitoring economics and deployment programs for industrial and municipal operators.