Membrane replacement represents one of the largest single operational expenses for membrane-based water treatment systems. With membrane element costs varying widely by application and membrane type, optimizing membrane life through anti-fouling strategies delivers substantial economic benefits. This analysis examines the economics of anti-fouling technology investment and strategies for reducing membrane replacement costs.
Table of Contents
Membrane Cost Structure Analysis
Capital and Operating Cost Distribution
Membrane system costs span multiple categories:
Initial Capital Investment: Membrane modules, housings, piping, instrumentation, and installation typically cost $800-3,000/m³/day of treatment capacity.
Membrane Replacement: Annual replacement costs vary widely with application severity and operating conditions. For fouling-prone services, replacement commonly dominates the operating budget; for clean feeds it is a minor line item. Benchmark your own replacement history before assuming either case.
Energy Consumption: $0.05-0.20/m³ for membrane systems, varying with recovery rates and feedwater quality.
Chemical Consumption: $0.02-0.10/m³ for cleaning agents, scale inhibitors, and pre-treatment chemicals.
Labor and Maintenance: $0.02-0.08/m³ for operational management and preventive maintenance.
Membrane Lifespan Factors
Actual membrane life varies based on multiple factors:
| Factor | Typical Lifespan Impact |
|---|---|
| Feedwater quality | 3-7 years (good to poor quality) |
| Operating flux | 2-5 years (high to excessive flux) |
| Cleaning frequency | 4-8 years (optimized to excessive) |
| Chemical exposure | 2-6 years (chlorine-tolerant to sensitive) |
| Temperature operation | 3-7 years (moderate to extreme) |
Membrane Age-Related Performance Decline
Membrane performance degrades over time:
Flux Decline: A reduction on the order of 10-15% over a 5-year operational period is common under normal conditions
Rejection Degradation: Salt rejection typically declines slightly over membrane lifetime
Physical Degradation: Compaction, fouling layer consolidation, and material degradation contribute to performance decline
Anti-Fouling Technology Economics
Investment Cost Analysis
Anti-fouling technology investments span capital and operational categories:
Pre-Treatment Systems:
- Multimedia filtration: $50-150/m³/day capital, $0.01-0.03/m³ operational
- Cartridge filtration: $10-30/m³/day capital, $0.02-0.05/m³ operational
- Chemical dosing: $5-20/m³/day capital, $0.01-0.04/m³ operational
Anti-Fouling Membranes:
- Surface-modified membranes: 10-25% capital premium
- Self-cleaning membrane modules: 20-40% capital premium
- Anti-scaling coated membranes: 15-30% capital premium
Monitoring and Control:
- Online analyzers: $10,000-50,000 capital
- SCADA integration: $5,000-25,000 capital
- ML-based optimization: $15,000-75,000 capital
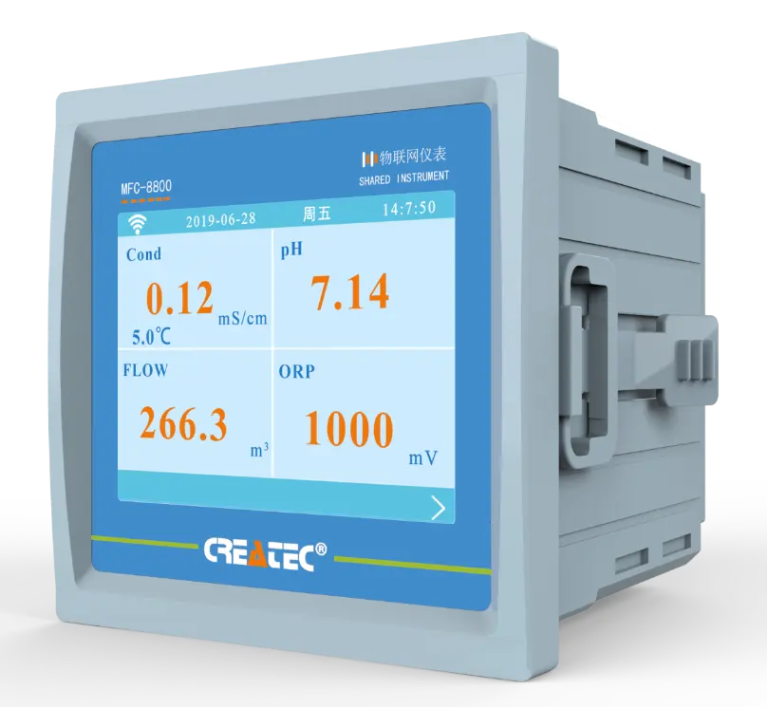
Shanghai ChiMay provides cost-effective monitoring solutions supporting anti-fouling investment optimization.
Membrane Life Extension Benefits
Anti-fouling strategies extend membrane life; the figures below are planning-level expectations, not guarantees — validate against your own baseline:
Optimized Cleaning: Data-driven cleaning protocols can meaningfully extend life
Pre-Treatment Enhancement: Improved feed quality is usually the highest-leverage measure
Flux Optimization: Reduced operating flux extends life at the cost of installed area
Combined Approach: An integrated anti-fouling program combining all three typically delivers the largest life extension
Annual Cost Savings Levers
Savings from anti-fouling investment come from four levers:
Membrane Replacement Reduction: Deferring a replacement cycle on a mid-size system can save tens to hundreds of thousands of dollars depending on membrane area and element pricing.
Cleaning Cost Reduction: Fewer clean-in-place cycles directly reduce chemical consumption and disposal costs.
Energy Efficiency: Clean membranes operate at lower differential pressure for the same flux.
Labor Reduction: Fewer emergency interventions and unplanned maintenance events.
Total Cost of Ownership Analysis
TCO Model Framework
Comprehensive TCO analysis incorporates:
Capital Expenditure (CapEx):
- Membrane modules and housings
- Pre-treatment equipment
- Instrumentation and control systems
- Installation and commissioning
Operational Expenditure (OpEx):
- Energy consumption
- Chemical consumption
- Membrane replacement
- Labor and maintenance
- Monitoring and analysis
End-of-Life Costs:
- Membrane disposal
- Equipment decommissioning
- Site restoration
Comparative TCO Analysis
Illustrative TCO comparison between standard and anti-fouling approaches (directionally representative — populate with your own data for real decisions):
| Cost Category | Standard Operation | Anti-Fouling Program | Annual Savings |
|---|---|---|---|
| Membrane replacement | $100-200/m² | $65-130/m² | $35-70/m² |
| Cleaning chemicals | $0.03-0.08/m³ | $0.015-0.04/m³ | $0.015-0.04/m³ |
| Energy consumption | $0.10-0.20/m³ | $0.08-0.16/m³ | $0.02-0.04/m³ |
| Labor and maintenance | $0.04-0.08/m³ | $0.03-0.06/m³ | $0.01-0.02/m³ |
| Total OpEx | $0.17-0.36/m³ | $0.125-0.26/m³ | $0.045-0.10/m³ |
Return on Investment Calculation
Example Calculation (illustrative 1,000 m³/day membrane system):
- Membrane area: 2,000 m²
- Annual treatment volume: 365,000 m³
- Anti-fouling investment: $150,000 capital + $15,000/year operational
Illustrative Annual Savings:
- Membrane replacement deferral: $70,000-140,000
- Cleaning chemicals: $5,000-15,000
- Energy efficiency: $5,000-10,000
- Labor reduction: $3,000-8,000
- Total annual savings: $83,000-173,000 (range reflects how aggressive the baseline fouling problem is)
With these assumptions, payback of 12-24 months and returns of 150-250% over system lifetime are arithmetically consistent — but they are outcomes of the example inputs, not industry benchmarks. Run the calculation with your own membrane area, replacement history, and fouling rate.
Preventive Maintenance Programs
Preventive Maintenance Framework
Systematic maintenance programs optimize membrane life:
Daily Monitoring Requirements:
- Transmembrane pressure logging
- Permeate flow measurement
- Feed and permeate conductivity
- Pre-treatment system performance
Weekly Maintenance Activities:
- Backwash optimization review
- Chemical inventory assessment
- Filter replacement assessment
- Alarm and event review
Monthly Maintenance Tasks:
- Cleaning protocol optimization
- Membrane integrity testing
- Performance trend analysis
- Preventive maintenance scheduling
Shanghai ChiMay monitoring systems support preventive maintenance execution.
Performance Tracking and Trending
Data-driven maintenance optimization:
Key Performance Indicators:
- Specific flux (LMH/bar)
- Salt rejection percentage
- Transmembrane pressure trends
- Cleaning frequency and effectiveness
Trend Analysis:
- Seasonal variation identification
- Fouling pattern recognition
- Membrane degradation assessment
- Cost trend monitoring
Predictive Maintenance:
- Remaining useful life estimation
- Replacement timing optimization
- Budget forecasting
- Inventory management
Maintenance Documentation
Systematic record-keeping supports optimization:
Maintenance Logs: Detailed records of all maintenance activities
Performance Records: Historical data supporting trend analysis
Cleaning Records: Protocol effectiveness assessment
Cost Tracking: Budget management and optimization
Anti-Fouling Strategy Implementation
Phased Implementation Approach
Systematic anti-fouling program development:
Phase 1 – Assessment (1-3 months):
- Current fouling analysis
- Cost structure evaluation
- Technology assessment
- Investment planning
Phase 2 – Monitoring Enhancement (1-2 months):
- Sensor installation
- SCADA integration
- Baseline data collection
- Threshold development
Phase 3 – Protocol Optimization (3-6 months):
- Cleaning protocol refinement
- Pre-treatment optimization
- Operating parameter adjustment
- Staff training
Phase 4 – Continuous Improvement (ongoing):
- Performance monitoring
- Protocol refinement
- Technology upgrades
- Cost optimization
Success Metrics
Measuring anti-fouling program effectiveness:
| Metric | Direction of Success |
|---|---|
| Membrane life | Extended |
| Cleaning frequency | Reduced |
| Energy consumption | Reduced |
| Emergency interventions | Reduced |
| Total operating cost | Reduced |
Set quantitative targets from your own baseline, not generic percentages.
Stakeholder Communication
Effective program communication:
Management Reporting: Regular updates on program performance and cost savings
Operational Guidance: Clear protocols and procedures for maintenance staff
Vendor Coordination: Collaborative relationships with membrane and chemical suppliers
Regulatory Compliance: Documentation supporting permit compliance
Case Study: Illustrative Economics
Industrial Wastewater Treatment Facility (illustrative example)
Facility Profile:
- Treatment capacity: 2,000 m³/day
- Membrane area: 4,000 m² (NF/RO system)
- Application: Chemical manufacturing wastewater reuse
Pre-Implementation Conditions:
- Membrane life: 3.5 years
- Cleaning frequency: Monthly
- Annual membrane cost: $160,000
- Total operating cost: $0.28/m³
Anti-Fouling Program Implementation:
- Enhanced pre-treatment investment: $180,000
- Online monitoring system: $75,000
- Protocol optimization: $15,000
- Total investment: $270,000
Illustrative Post-Implementation Results:
- Membrane life: 5.5 years (+57%)
- Cleaning frequency: Quarterly (-66%)
- Annual membrane cost: $95,000 (-41%)
- Total operating cost: $0.21/m³ (-25%)
Illustrative Economic Analysis:
- Annual savings: $145,000
- ROI over 5 years: 268%
- Payback period: 22 months
Treat this as a worked example of the method, not a documented case. The structure — baseline, investment, deltas, payback — is what transfers to real projects.
Future Cost Optimization Opportunities
Emerging Technologies
Advanced technologies for cost reduction:
Self-Healing Membranes: Polymer technologies that repair minor damage extending membrane life
Graphene-Enhanced Membranes: Improved durability and anti-fouling properties
Predictive AI Systems: Machine learning optimization reducing operational costs
Membrane Recycling: End-of-life material recovery reducing replacement costs
Process Integration
Combined treatment approaches:
Forward Osmosis Integration: Lower-energy concentration processes
Membrane Distillation: Low-cost thermal coupling opportunities
Biological Pretreatment: Organic loading reduction through biological treatment
Procurement Optimization
Strategic sourcing approaches:
Long-Term Contracts: Volume commitments in exchange for lower pricing
Framework Agreements: Established pricing for predictable requirements
Supplier Partnerships: Collaborative relationships with technology providers
Conclusion
Membrane replacement is one of the largest single operational expenses for membrane systems, and anti-fouling technology investment consistently reduces replacement frequency, cleaning cost, and unplanned downtime. The economics are strongest where fouling is severe — which is exactly where monitoring pays for itself fastest.
Shanghai ChiMay monitoring equipment provides the instrumentation foundation for anti-fouling program success. Online analyzers, turbidity sensors, conductivity meters, and data acquisition systems enable the comprehensive monitoring necessary for proactive fouling management.
Organizations seeking to optimize membrane system economics should:
- Implement comprehensive monitoring enabling proactive fouling management
- Invest in pre-treatment systems reducing fouling at source
- Develop data-driven cleaning protocols optimizing chemical consumption
- Establish preventive maintenance programs extending membrane life
- Track performance metrics demonstrating and guiding improvement
The economic analysis confirms that anti-fouling investment is sound financial strategy where fouling costs are material — delivering returns that exceed alternative capital investments while improving system reliability and reducing environmental impact.