Water utilities are in the middle of a slow, uneven transition. Traditional operation — periodic manual monitoring, reactive maintenance, planning from historical averages — is giving way to systems that continuously assess network health, predict problems before they surface, and adjust operations in real time. Cervicorn Consulting values the global digital water market at roughly USD 7.18 billion in 2025, rising to about USD 22.02 billion by 2035 at a compound annual growth rate of 11.9 % — a forecast that reflects how widely utilities now accept digital infrastructure as core rather than optional. This article covers the technologies, implementation patterns and results behind that change.
Table of Contents
Understanding the Smart Water Grid Concept
Definition and Core Components
A smart water grid integrates sensing, communication and analytics to create an intelligently operated distribution network. The concept parallels smart electricity grids, applied to water-specific problems.
Core components:
Sensors and meters: continuous monitoring of flow, pressure, quality and environmental conditions across the network.
Communication infrastructure: reliable, secure transmission from sensors to central systems using cellular, LPWAN or fibre networks.
Data management platforms: cloud or edge systems that aggregate, store and process monitoring data.
Analytics and intelligence: software that turns raw data into decisions through statistical analysis, machine learning and optimisation.
Human–machine interface: dashboards, alerts and reporting that let operators see system status and act on it.
Differences from Traditional Water Management
Traditional water management relies on:
- Periodic manual readings: meter readers collecting consumption data monthly or quarterly
- Reactive maintenance: fixing problems after they disrupt service
- Estimated demand: planning from historical averages rather than current conditions
- Segmented systems: limited integration between production, distribution and consumption monitoring
Smart water grids enable:
- Continuous automatic monitoring: real-time data from every instrumented point
- Predictive maintenance: addressing problems before failure
- Dynamic optimisation: adjusting operations to actual conditions
- Integrated systems: one view of water from source to consumer
IoT Sensor Technologies Enabling Smart Water Management
Advanced Metering Infrastructure
Modern smart meters do considerably more than measure consumption:
High-resolution consumption data: 15-minute or hourly readings enable detailed pattern analysis.
Remote reading: automatic collection eliminates manual rounds and speeds up response to anomalies.
Leak detection: continuous-flow analysis identifies leaks on customer premises.
Tamper detection: sensors identify meter manipulation and protect revenue.
Time-of-use metering: enables demand-response programmes and differential tariffs.
Pressure and Flow Monitoring
Pressure transmitters support:
– Pressure zone optimisation
– Leak detection through pressure-drop analysis
– Pump optimisation against demand patterns
– Critical-point monitoring for service reliability
Flow meters support:
– District metered area (DMA) balance calculations
– Background leakage estimation
– Peak demand identification
– Validation of network hydraulic models
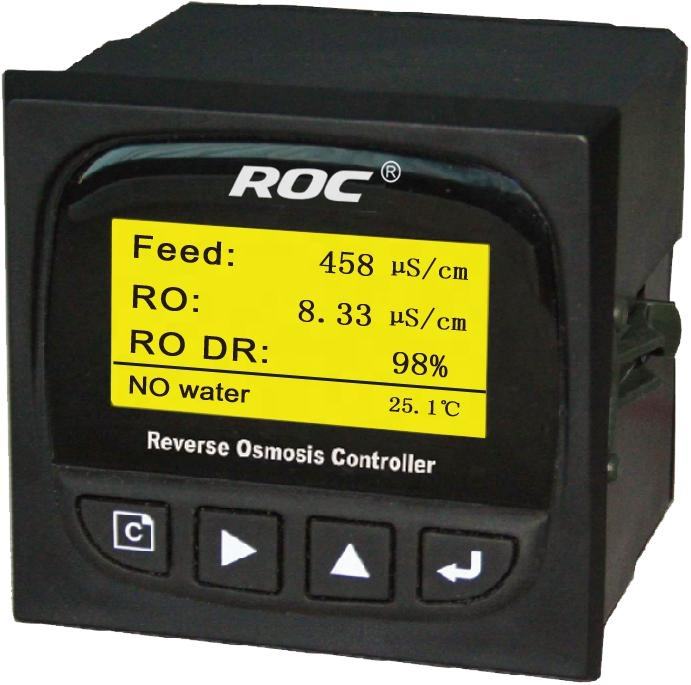
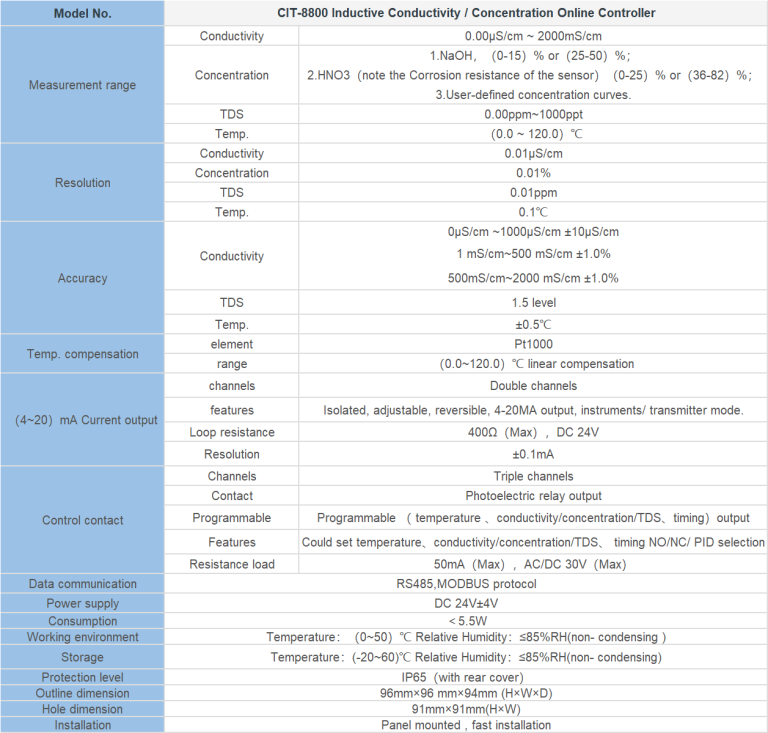
Shanghai ChiMay supplies flow meters, pressure transmitters and water quality analyzers for exactly these continuous-monitoring roles, including the instrumentation needed to make DMA boundaries meaningful.
Water Quality Monitoring Networks
Distributed quality monitoring adds a second layer of visibility:
Continuous monitoring points placed strategically through the distribution system support rapid contamination detection.
Multi-parameter analysis — pH, chlorine residual, conductivity and turbidity — provides a comprehensive quality picture.
Early warning systems flag quality changes before they reach consumers.
Regulatory compliance: continuous monitoring meets monitoring-frequency obligations while producing better data than grab sampling.
Artificial Intelligence and Machine Learning Applications
Predictive Maintenance for Infrastructure
The practical AI wins in water networks are unglamorous and specific:
Equipment failure prediction: models trained on operational data flag pumps, valves and meters trending toward failure.
Leak prediction: algorithms rank pipe segments by failure probability, which is what makes proactive replacement affordable.
Maintenance optimisation: scheduling that trades cost against reliability instead of defaulting to calendar intervals.
Degradation detection: subtle changes in behaviour that indicate a developing problem.
Reported results from utility predictive maintenance programmes vary widely with data quality and asset age, but the pattern is consistent: fewer unplanned events, longer useful asset life and lower maintenance spend than calendar-based maintenance delivers.
Demand Forecasting and Optimisation
Short-term forecasting: hourly and daily demand prediction enables optimised pumping schedules.
Seasonal modelling: long-term forecasts inform capacity planning and capital investment.
Climate integration: weather forecast input predicts the demand impact of temperature and precipitation.
Anomaly detection: unusual consumption patterns point to leaks or meter problems.
Network Optimisation
Pump scheduling: algorithms minimise energy while meeting demand and pressure requirements.
Pressure management: zone pressure optimisation reduces leakage while holding service quality.
Water age management: minimising residence time so disinfectant residual holds through the network.
Energy recovery: variable frequency drives and controls recover energy from pressure reduction.
Operational benefits from AI-assisted optimisation are reported across three areas — lower pumping energy, lower real water losses, and better hydraulic performance against the design envelope — with the actual magnitude depending on how much of the network is instrumented before the algorithms are applied. The dependency runs the other way from the marketing: analytics cannot improve what the sensors do not measure.
Smart Water Grid Implementation Strategies
Phased Implementation Approach
Phase 1 – Foundation (Years 1–2):
– Install advanced metering infrastructure
– Deploy initial pressure and flow monitoring
– Establish the data management platform
– Implement basic analytics and reporting
Phase 2 – Expansion (Years 2–4):
– Complete the AMI rollout
– Deploy the water quality monitoring network
– Implement predictive maintenance
– Integrate customer portal and engagement tools
Phase 3 – Optimisation (Year 4 onward):
– Deploy advanced AI applications
– Implement autonomous optimisation where the risk case supports it
– Integrate with smart city platforms
– Enable demand-response programmes
Critical Success Factors
Executive sponsorship: sustained investment and organisational change need leadership commitment.
Data quality: analytics are only as good as the sensors and the maintenance behind them.
Integration architecture: open systems enable phased implementation and later technology changes.
Change management: staff training determines whether the tools are used or bypassed.
Vendor partnership: long-term support matters more than the initial feature list.
Case Studies: What Utility Programmes Actually Look Like
The programmes that get written up tend to share a shape, even where the numbers differ. The three composites below reflect the scopes and outcomes commonly reported rather than a single named utility.
European Utility Smart Metering Initiative
A European metropolitan utility deployed comprehensive smart metering across its service area:
Implementation scope:
– Several hundred thousand smart meters deployed over three years
– A programme of pressure monitoring points covering the main district metered areas
– Flow meters on the principal distribution mains
– A central data platform with analytics capability
Results reported:
– Material reduction in real water losses through systematic leak detection
– Lower pumping energy through pressure and schedule optimisation, against a higher starting baseline than most utilities
– A large reduction in meter reading labour cost
– Fewer billing complaints, largely because estimated bills disappeared
– Operating savings sufficient to fund the next phase of the rollout
North American Utility Predictive Maintenance Programme
A North American water utility applied AI-based condition monitoring to its pumping fleet:
Implementation scope:
– Condition monitoring on over a thousand pumps
– Position monitoring on critical valves
– Machine learning models for equipment health assessment
– Integration with the work order management system
Results reported:
– Failure prediction accurate enough to be acted on, rather than a research result
– A meaningful reduction in unplanned maintenance events
– Extended average pump life
– Maintenance cost savings that covered the monitoring platform several times over
Asian Utility Water Quality Monitoring Network
A large Asian city instrumented its distribution network for quality:
Implementation scope:
– Hundreds of continuous water quality monitors across the distribution system
– Real-time anomaly detection
– Automated alert and response protocols
– A public information dashboard
Results reported:
– Complaints triaged and resolved far faster, because the utility could see the network condition at the time of the complaint
– High compliance with regulatory monitoring requirements, since the data existed continuously rather than only at sampling points
– Early detection of contamination events that grab sampling would have missed
The common thread is not the technology. It is that instrumentation density and data discipline had to be in place before the analytics produced anything worth acting on.
Economic Analysis and Return on Investment
Cost Categories
Capital costs, as industry planning ranges:
- Advanced metering infrastructure: USD 150–300 per service connection
- Network monitoring sensors: USD 5,000–15,000 per monitoring point
- Communication infrastructure: USD 20–50 per connection
- Data management platform: USD 500,000–2,000,000 initial investment
- Integration and implementation: 15–25 % of hardware cost
Operating costs:
- Communication services: USD 2–5 per connection annually
- Platform maintenance: USD 50,000–150,000 annually
- Sensor maintenance and calibration: USD 500–2,000 per monitoring point annually
- Staff training and support: variable by utility size
Return on Investment
Quantifiable benefits:
- Water loss reduction, valued at the utility’s marginal cost of supply
- Energy savings per kWh avoided
- Maintenance cost reduction from moving off calendar-based scheduling
- Labour productivity gains in meter reading and field work
- Avoided compliance penalties
Typical payback: three to five years for comprehensive smart water grid implementation, depending on baseline losses and the utility’s cost structure. Programmes that start with pressure management and DMA-level flow metering generally pay back faster than programmes that start with a full AMI rollout, because the water savings arrive sooner.
Non-quantifiable benefits: better regulatory relationships, improved customer satisfaction, stronger environmental performance, and organisational capability that carries into the next investment cycle.
Technology Trends Shaping Future Development
Edge Computing and Distributed Intelligence
Processing moves closer to the data source: sensors perform initial analytics locally, network bandwidth requirements fall, critical alerts arrive faster, and system resilience improves because intelligence is distributed rather than centralised.
5G and Advanced Communications
High-bandwidth, low-latency networks enable real-time video monitoring, augmented reality for field operations, dense IoT connectivity and network slicing for security separation.
Digital Twin Technology
Virtual replicas of physical systems support simulation-based planning, scenario analysis without physical testing, operator training, and tighter integration with GIS and hydraulic models.
Blockchain for Water Rights and Trading
Distributed ledger applications are being piloted for water rights verification and trading, supply chain transparency, automatic billing and settlement, and audit trails.
Challenges and Considerations
Cybersecurity Requirements
Connected water systems create real cybersecurity exposure:
Threat landscape: attacks on operational technology, privacy obligations for customer data, physical security of distributed equipment, and supply chain risk in connected devices.
Mitigation: defence-in-depth architecture, continuous security monitoring, regular vulnerability assessment, incident response planning, and staff training.
Data Privacy and Management
Large-scale data collection raises privacy questions that must be answered explicitly: protection of customer consumption data, retention and deletion policy, third-party data sharing agreements, and applicable regulatory requirements.
Legacy System Integration
Existing infrastructure creates integration work: compatibility with SCADA and other operational systems, meter data management, customer information systems, and work order and asset management platforms.
Workforce Evolution
Technology adoption changes the workforce: new skills for operating digital systems, data analytics capability, change management support, and career paths for digital water professionals. The skills gap, not the sensor cost, is what slows most programmes down.
Recommendations for Utility Decision-Makers
Strategic Planning
Assess the current state: infrastructure, data capability and organisational readiness, honestly.
Define the roadmap: clear objectives and a phased timeline.
Build the business case: quantify costs and benefits against the utility’s own loss and energy baselines rather than against published averages.
Develop a data strategy: architecture, governance and analytics capability.
Plan for change: the organisational and workforce implications, from the beginning.
Technology Selection
Prioritise interoperability: open, standards-based systems that will still integrate in ten years.
Validate vendor capability: experience, financial stability and long-term support.
Plan for scalability: solutions that support phased implementation and later expansion.
Evaluate total cost of ownership: lifecycle cost, not purchase price.
Require security: security features and ongoing support as a scored criterion, not a checkbox.
Conclusion
The smart water grid is less a product than an operating model: instrument the network, keep the data clean, then let analytics improve what the instrumentation revealed. Utilities that follow that order — IoT measurement first, intelligence second — report real reductions in water loss, energy and maintenance cost, and they survive regulator and customer scrutiny of the numbers they publish. Shanghai ChiMay supplies the measurement foundation for those programmes, with sensor portfolios covering flow, pressure and water quality. The investment is substantial; the returns depend on whether the sensors are installed and maintained well enough to trust.