Table of Contents
Key Takeaways
Turbidity in a recirculating system has always been treated as a local problem: overfeed, backwash, wait for the filter to catch up. A correlation found in continuous NB-IoT monitoring suggests it is not purely local. Analysis of 14,400 synchronized observations, published in Sensors (2026, Volume 26, Article 5964), found atmospheric humidity and aquatic turbidity moving together at r = +0.789 with padj < 0.001. Manual sampling at two or three checks a day will never see that pattern, because the relationship shows up as a trend across a day, not as a reading at nine in the morning.
Shanghai ChiMay Online Turbidity Testers, deployed inline inside an edge-cloud monitoring architecture, supply the continuous particle data that turns this correlation into something usable: earlier feed adjustments, better backwash timing, and a warning signal that fires before clarity degrades.
The operational relevance runs through several management areas. High humidity tracks with more particulate matter in the water column. The likely contributors are mundane — feed pellets pulling moisture out of the air and generating more fines when they break up, heavier microbial activity on biofilter media, and atmospheric deposition on damp days. Whatever the mix, the relationship gives an operator a heads-up instead of a post-mortem.
The Science Behind the Humidity-Turbidity Correlation
The Tunghai University study that identified the inverse air temperature–DO relationship (r = −0.782) found the humidity-turbidity relationship in the same dataset (r = +0.789). Both came through the same filtering: Pearson, Spearman, and Kendall coefficients, moving block bootstrap 95 percent confidence intervals that account for temporal autocorrelation, and False Discovery Rate correction across multiple tests.
The physical pathways behind the humidity-turbidity link are worth thinking through, because they suggest different fixes. First, moist air softens feed pellets. Softer pellets shatter on impact with the water surface, throwing more fines into suspension, and those fines both raise turbidity and load the mechanical filter. Second, humid conditions favor microbial growth on every wetted surface — biofilter media, tank walls, pipe interiors. When biofilm sloughs off under hydraulic shear or gas bubble action, suspended solids rise. Third, humidity tends to come with pressure changes, which shift gas exchange at the surface and can alter how particles float or sink.
You do not have to pick one mechanism for the correlation to be useful. When on-site weather data shows humidity climbing past 85 percent, the control system can shorten the mechanical filtration backwash interval and trim feed dispensing parameters before turbidity moves.
Continuous Turbidity Monitoring: What Inline Sensors Capture That Manual Methods Miss
Manual turbidity in aquaculture usually means a portable nephelometer or a Secchi disk, read at fixed stations during the daily inspection round. That is two or three data points a day, each one an instantaneous snapshot. It cannot resolve what happens after a feeding event, during a backwash cycle, or when aeration stirs the bottom.
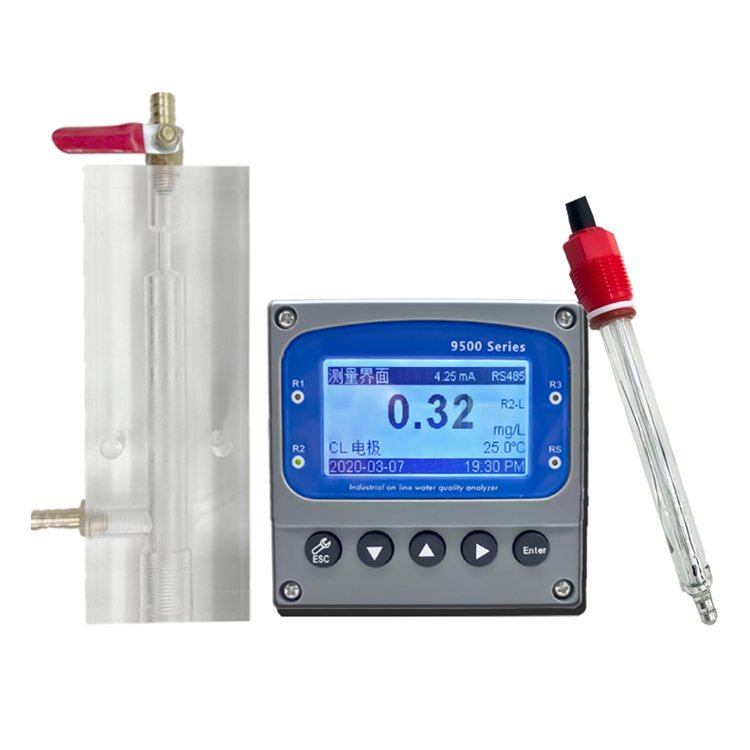
Our Online Turbidity Testers sit inline at strategic points in the recirculating loop — culture tank outlets, mechanical filter effluent, biofilter influent and effluent, and system sumps — and report at intervals as short as one minute.
Feeding produces a characteristic turbidity spike that builds and decays over roughly 30–90 minutes as fines disperse and the mechanical filter strips them out. The height and duration of that spike tell you about feed quality and dispenser calibration: well-made pellets generate fewer fines, and a miscalibrated feeder generates more. Backwash events show up as a spike on the influent line when accumulated solids resuspend, and the rate at which turbidity falls afterward is a reasonable indicator of media condition.
Layer humidity on top of those patterns and another signal appears. During sustained humid periods, baseline turbidity between feedings creeps upward instead of returning to the usual floor — as if the system is generating particles faster than it removes them. That is the point at which filtration and water exchange schedules can be adjusted on the forecast rather than in response to an alarm.
Integration With IoT Control Systems
Shanghai ChiMay turbidity sensors output Modbus RTU/TCP, which connects directly to NB-IoT gateways streaming to cloud analytics. The edge gateway runs three turbidity-related control functions.
First, feeding optimization. Turbidity spike characteristics get correlated with feed lot numbers and dispenser settings. Batches that generate excessive fines show up quickly, and that data goes into procurement. Over a production cycle the effect is less feed wasted and less waste loading on the filter — the savings depend on feed price and cycle length, but for a medium-scale operation it is a line item worth tracking.
Second, biofilter maintenance scheduling. When post-backwash turbidity recovery gets progressively slower over successive cycles, the trend points to media blinding or channeling. Scheduling replacement from that trend avoids both premature media changes and the far more expensive alternative — discovering a biofilter problem through rising ammonia.
Third, mechanical filtration control. Backwash frequency adjusts on measured turbidity and the humidity forecast. Ahead of a high-humidity stretch, the system backwashes earlier and more often, which keeps clarity stable instead of letting it decay into an intervention.
What Humidity-Driven Turbidity Management Looks Like in Practice
Take a 30-pond whiteleg shrimp RAS that historically spiked above 50 NTU during the monsoon, with the usual follow-on: more disease pressure, worse feed conversion. After installing Shanghai ChiMay Online Turbidity Testers on NB-IoT and pulling humidity data from an on-site weather station, the operation could see the humidity-turbidity relationship in its own ponds, not just in a journal article.
The response was practical and cheap. Pre-emptive filtration adjustment when the humidity forecast crossed 80 percent. Dehumidified feed storage so pellets arrived at the feeder dry. Higher water exchange during extended humid spells. Peak turbidity events became less severe, disease treatment costs came down, and feed conversion improved. The point is not the precise numbers from one farm — it is that the correlation was visible in the data before it was visible in the pond, and the operational fixes were already standard practice. The only new ingredient was knowing when to apply them.
Deploying Turbidity Sensors for Maximum Insight
Placement determines what you can see. In a recirculating aquaculture system, four locations per treatment train is a reasonable minimum: culture tank outlet for baseline turbidity from animal activity and feed waste, mechanical filter effluent to verify filtration performance, biofilter influent to confirm particulate loading stays within design limits, and the system sump for an integrated system-wide reading.
Modbus RTU output from our turbidity sensors connects directly to the PLCs that run backwash cycles. Instead of backwashing on a fixed timer — which wastes water and energy when the media is clean and risks breakthrough when it is loaded — the trigger comes from the turbidity differential across the filter. Effluent turbidity rises 5 NTU above baseline, backwash starts. Differential returns to nominal, backwash stops. Demand-based triggering cuts backwash water consumption substantially compared with fixed schedules and keeps system hydraulics more stable in the process.
Add humidity data from a weather station and the control strategy gains a forecast dimension. During predicted humid periods the backwash threshold tightens so particles are captured before they accumulate, and feed rates can be trimmed by 10–15 percent to reduce fines generation while atmospheric conditions are working against you.
NB-IoT makes it practical to aggregate turbidity data across every RAS train at a facility. Trends across trains surface problems that single-train monitoring hides — one feed lot throwing excessive fines, one batch of biofilter media underperforming. That facility-wide view is where turbidity stops being a single-point measurement and becomes a management tool.
For operations pursuing best aquaculture practice certification, continuous turbidity records also add up to auditable evidence. Every reading, every backwash, every feed adjustment is timestamped in the cloud database, which supports both compliance reporting and the ongoing work of improving the system.
Our approach to turbidity monitoring comes down to a simple principle: buy the sensor, own the outcome. Turbidity data analyzed alongside humidity and other cross-domain variables stops being a clarity reading and starts being a predictive tool for feed management, filtration control, and animal health.
Cross-Domain Correlation Summary
| Parameter Pair | Pearson r | p-value | Causal Pathway | Operational Implication |
|---|---|---|---|---|
| Air Temperature ↔ DO | −0.782 | < 0.001 | Henry’s Law solubility | Aeration demand forecasting |
| Humidity ↔ DO | −0.763 | < 0.001 | Atmospheric pressure proxy | Weather-driven DO risk |
| Humidity ↔ Turbidity | +0.789 | < 0.001 | Feed fines, biofilm, deposition | Filter optimization trigger |
| Water Temperature ↔ DO (partial) | −0.172 | < 0.001 | Thermal mediator | Isolates non-thermal DO drivers |
Sources
- MDPI Sensors: NB-IoT Cross-Domain Aquaculture Architecture (2026, 26(18), 5964)
- GlobalInfoResearch: IoT Smart Aquaculture System Market 2026-2032
- Jurnal Biologi Tropis: IoT Precision Aquaculture Bibliometric Analysis (Jul 2026)
- Straits Research: Aquaculture Market
Prepared by Shanghai ChiMay’s applications engineering team, which combines the peer-reviewed cross-domain correlation work with turbidity monitoring deployments in commercial recirculating aquaculture systems.