Board Briefing · Decision-Maker Perspective · Published: September 30, 2026
Table of Contents
Key Takeaways
- Water disclosure moved from narrative to numbers. Around 4,815 companies reported through CDP’s water security questionnaire in 2023 — over 4,800 by CDP’s own count, against 13,356 invited [3].
- The money at stake is on the record. CDP’s Global Water Report 2023 put at least US$77 billion of business value under threat from water risk in supply chains, with almost US$7 billion at immediate risk [4].
- Physical exposure is measurable now. WRI’s Aqueduct data found 25 countries, home to roughly a quarter of the world’s population, in extremely high water stress, using over 80% of their renewable supply each year [5].
- The frameworks converge on the same data spine. GRI 303 (2018 revision, effective January 2021) wants withdrawal, discharge and consumption with source breakdowns and separate reporting for water-stressed areas [1]; CDP wants the stressed-basin share of withdrawals plus a five-year forecast [2]; ESRS E3 requires total consumption, withdrawal and discharge metrics for CSRD reporters [6].
- All of them want facility-level, source-level, time-series data. That is what metered intakes, flow measurement and online analyzers produce — not what you can reconstruct in November from invoices and estimates.
- Treat the path from sensor to statement as part of the reporting system. Your assurance provider already does.
Why Water Reporting Suddenly Has Teeth
For two decades, corporate water disclosure was a voluntary storytelling exercise. That era is finished. Disclosure volumes, regulatory mandates and buyer requirements converged, and water now sits next to carbon in the reporting stack boards actually read.
Participation is the clearest evidence. CDP counted about 4,815 companies filing water data in 2023 — a big jump on the prior year and only a fraction of the 13,356 companies it invited [3]. Growing that fast against an invited base means water reporting is no longer something a sustainability team does when the calendar allows. Procurement, investors and regulators increasingly assume it.
The second driver runs through the customer chain. CDP’s supply-chain analysis put at least US$77 billion of business value under threat from water risk in supplier networks, with almost US$7 billion at immediate risk. The same research found 1,542 companies — half of the large buyers analysed — engaging their suppliers on water, and 118 global brands attaching financial incentives to that engagement [4]. A supplier who cannot produce credible water numbers is not just unprepared for a questionnaire. It is a weaker bidder in accounts that score on one.
The third driver is physical. WRI’s Aqueduct Water Risk Atlas identified 25 countries, roughly a quarter of the global population, exposed to extremely high water stress every year, consuming more than 80% of their renewable supply across irrigation, industry and domestic use [5]. In a basin that tight, a factory’s intake and discharge stop being local operating details. They become the raw material of regional risk models that investors and customers read.
What the Frameworks Actually Ask For
Board conversations about “ESG water reporting” tend to blur five different instruments. They ask overlapping questions, but not identical ones, and each maps to a different internal data source. The table below is the mapping your disclosure team needs before anyone starts talking about software.
| Framework | Core disclosure asks | Where the data comes from |
|---|---|---|
| GRI 303: Water and Effluents (2018) | Withdrawal, discharge and consumption volumes; breakdown by source; separate figures for water-stressed areas; management of discharge-related impacts [1] | Metered intakes by source; discharge flow measurement; effluent quality analyzers; site water balances |
| CDP Water Security questionnaire | Share of withdrawals from water-stressed areas, year-on-year change and five-year forecast; risk assessments; targets and performance; A-to-F scoring [2][3] | Site water accounting; basin risk tools; online monitoring for withdrawal and effluent metrics |
| ESRS E3 (under CSRD) | Policies, actions and targets; total water consumption, withdrawal and discharge; consumption in water-stress areas [6] | Continuous or periodically metered volumes; site water balances; documented estimation methods |
| AWS Standard 2.0 | Site water balance, water quality at source and discharge, catchment context, five outcomes from governance to WASH; certification at Core, Gold or Platinum level | Site-level measurement program, catchment data, third-party audit evidence |
| CEO Water Mandate | Commitment across six areas of stewardship and annual progress reporting | Corporate water accounting plus basin-level engagement records |
Three rows deserve a closer look, because they define the metrics every other program reuses.
The Quantity Baseline: GRI 303
GRI 303 in its 2018 revision is the reference text for what “water data” means in a sustainability report. It applies to reports published on or after January 2021, and it pushed the discipline well past a single withdrawal number: volumes get broken down by source, and water-stressed areas get reported separately [1]. That one design choice is what forces a company to know which plants sit in which basins, and to meter accordingly. A corporate total with no site attribution no longer answers the question.
The Investor Lens: CDP Water Security
CDP asks the forward-looking questions the others leave open. Its questionnaire wants the proportion of withdrawals from water-stressed areas, how that share moved against the previous year, how it is forecast to move over five years, and which identification tools produced the answer [2]. Think about what that implies operationally. A five-year forecast of stressed-basin withdrawals requires a production plan, a site footprint and water intensity per unit of output, joined together. Spreadsheet archaeology in November will not produce it credibly. CDP then scores responses from A to F on transparency and performance, which is why the questionnaire behaves commercially like a rating rather than a survey [3].
The Regulatory Floor: ESRS E3
For companies inside the EU’s CSRD scope, ESRS E3 turns water disclosure from voluntary into statutory. The topical standard requires policies, actions and targets, plus quantitative metrics on total water consumption, withdrawal and discharge — including consumption within water-stress areas [6]. What that means for plant teams: the numbers behind a statutory statement need defined measurement methods and an audit trail. The same rigor financial data has always carried.
The Site-Level Programs: AWS and the CEO Water Mandate
Two further instruments work at site and commitment level. The Alliance for Water Stewardship Standard 2.0 evaluates a site against five outcomes — good water governance, sustainable water balance, good water quality, healthy important water-related areas, and safe water, sanitation and hygiene for all — with certification at Core, Gold or Platinum after third-party verification. The UN Global Compact’s CEO Water Mandate, established in 2007, asks endorsing companies to commit across six stewardship areas and report progress annually. Neither is a reporting format in the GRI sense. Both generate the measurement discipline the reporting frameworks assume.
Where the Numbers Come From
Strip the frameworks to their quantitative core and four data families remain: how much water came in and from where; how much went out and to where; what its quality was; and how all three trend over time. Every credible answer starts with instrumentation.
- Intake metering by source. The source-level breakdown GRI 303 asks for [1] is only as good as the meters on each intake line. One bulk meter on a mixed-source site makes the breakdown an estimate, and estimates age badly under assurance.
- Flow measurement at discharge points. Discharge volumes and their variability feed GRI 303 [1] and ESRS E3 [6] alike. Paddle-wheel or electromagnetic meters on effluent lines convert a permit obligation into timestamped data.
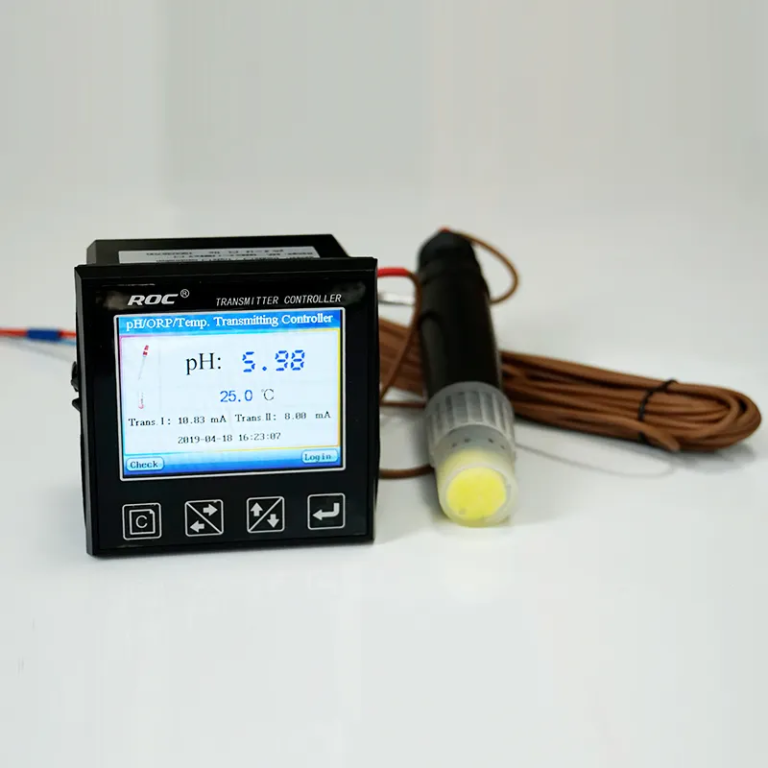
- Online water-quality analyzers. Effluent parameters, plus process parameters such as pH, conductivity and residual disinfectant, belong in the same reporting spine. Multi-parameter instruments that measure several parameters through one probe cut installation cost and keep every channel time-aligned, which matters when a report pairs volume and quality figures. “Four parameters. One probe. Zero alignment error.” is an engineering statement before it is a marketing one.
- Digital integration. Instruments with standard industrial interfaces hand data to the historian and the ESG platform without transcription. “Sensors that feed your AI water model, not just your dashboard” describes where all of this is heading: continuous, structured, machine-readable water records.
The economics favor fixing this at the sensor layer. Retrofit metering and instruments are a rounding error next to a qualified restatement, a failed assurance engagement or a lost customer audit — and the same online data runs the plant on Tuesday.
Report-Grade Data Quality
Assurance is the hinge between having data and being allowed to publish it. Reviews of independently assured water disclosures keep finding the same two patterns: reporters lean on quantity metrics, and they cite internal company protocols as the reporting basis. Both work — but only if those protocols are documented, stable and evidenced. Three practices make water data report-grade.
- Defined boundaries and methods. Every reported figure needs a written method: what is metered, what is calculated, which estimation factor applies, who signs off. Assurance reviewers test the method, not the number.
- Time-aligned records. Volumes, quality results and production data need to share a clock. Aligning them at the measurement layer — meters and analyzers writing into one historian — costs far less than reconciling them afterwards.
- Evidence retention. Calibration certificates, meter specifications, maintenance logs. These are what an auditor asks for, and keeping them retrievable per asset is what turns a claim into a disclosure.
None of this is exotic instrumentation work. It is ordinary measurement discipline applied to a deadline that no longer negotiates.
A 90-Day Starting Plan
Facing a CDP cycle or a CSRD preparation year, this sequencing works:
- Weeks 1-3 — footprint. List every site’s intakes and discharges with source type and existing metering. Map sites against basin stress classifications [2].
- Weeks 4-8 — instrument the gaps. Prioritize metered intakes by source and flow measurement at permitted discharge points. Standardize analyzer selection so parameters arrive time-aligned.
- Weeks 9-13 — dry run. Rebuild last year’s GRI 303 withdrawal table [1] and the CDP stressed-basin table [2] from the new pipeline. Note every figure that needed an estimate, then close those gaps before the next cycle.
Water reporting rewards the same instinct as plant engineering: measure where the material flows, keep the instruments calibrated, and let framework questions turn into retrieval exercises rather than annual emergencies.
References
- ESG Master — “GRI 303 Water & Effluents”: overview of the 2018 revision (effective January 2021), its withdrawal/discharge/consumption disclosures and water-stressed-area breakdowns. https://esgmaster.io/gri/gri-303-water
- CDP — Water Security 2023 Questionnaire, question W1.2d: withdrawals from water-stressed areas, year-on-year change, five-year forecast and identification tools. https://guidance.cdp.net/en/guidance?cid=W1.2d&ctype=ExternalRef&gettags=1&idtype=RecordExternalRef&incchild=1µsite=1&otype=questionnaire&page=1
- CDP — Disclosure Data Factsheet 2023 and CDP water security disclosure data: over 4,800 companies provided water security data in 2023; CDP scoring A-F. https://cdp.net/es/insights/cdp-2023-disclosure-data-factsheet
- CDP press release — “Water now a major risk for world’s supply chains”: US$77 billion under threat, almost US$7 billion at immediate risk, 1,542 companies (50%) engaging suppliers, 118 brands with financial incentives. https://www.cdp.net/en/press-releases/water-now-a-major-risk-for-worlds-supply-chains-reports-cdp
- WRI — “25 Countries, Housing One-Quarter of the Population, Face Extremely High Water Stress” (Aqueduct Water Risk Atlas): 25 countries, a quarter of the global population, using over 80% of renewable supply. https://www.wri.org/insights/17-countries-home-one-quarter-worlds-population-face-extremely-high-water-stress
- Reporting Academy — “ESRS E3 Water: Withdrawal, Consumption, Discharge and Water-Stress Reporting”: E3-4 metric requirements for total consumption, withdrawal, discharge and stressed-area figures. https://reporting.academy/en/knowledge-hub/disclosure-guides/esrs/esrs-topical-standards/esrs-e3-water-withdrawal-consumption-discharge-and-water-stress-report
About the author: Written by the Shanghai ChiMay Technical Editorial Team — the product group behind Shanghai ChiMay’s online water-quality analyzers and multi-parameter sensing instruments for industrial and municipal water programs.