The semiconductor industry demands water purity that approaches theoretical limits. At 300mm wafer geometries and below, even trace ionic contaminants can compromise device performance and yield. Resistivity monitoring serves as the primary indicator of water ionic purity, which makes it essential for maintaining the stringent quality standards in advanced fabrication facilities.
Table of Contents
Understanding Resistivity Specifications
Resistivity measurements express water’s opposition to electrical current flow, with ultrapure water topping out at approximately 18.2 MΩ·cm at 25°C. The measurement correlates inversely with conductivity—pure water conducts electricity poorly because the dissolved ions that carry charge have been removed through deionization and reverse osmosis.
That 18.2 number is a hard physical ceiling, and it makes the measurement unforgiving. Instrumentation for UPW applications needs to resolve variations well below 0.01 MΩ·cm so that system degradation shows up in the data before water quality affects manufacturing outcomes.
Temperature is the other complication. Near the purity limit, resistivity readings shift noticeably with small temperature changes—on the order of a couple of percent per degree Celsius—so continuous temperature compensation is not optional. Fab water distribution systems typically operate around 20-25°C, and the compensation algorithm has to hold accuracy across that range.
Inline Sensor Technologies
Modern semiconductor facilities deploy inline conductivity sensors rather than laboratory-based benchtop analyzers for continuous process monitoring. These sensors feature sealed electrode configurations that minimize contamination risks while providing real-time data streams for process control systems.
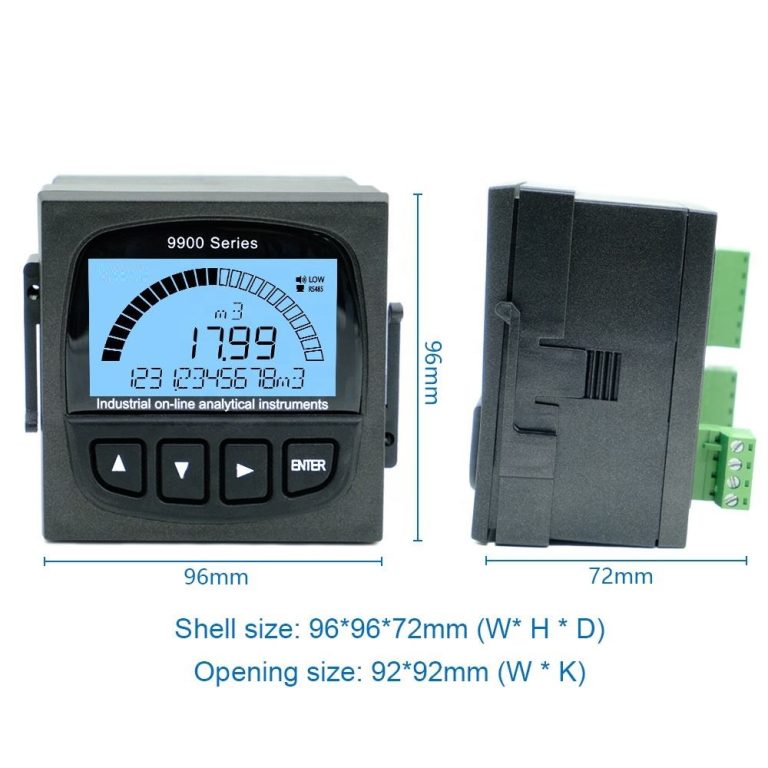
Shanghai ChiMay offers a range of inline conductivity instruments designed for high-purity water applications. These sensors use four-electrode configurations that eliminate the polarization effects common in two-electrode designs, supporting accurate measurements from municipal water quality up through ultrapure specifications.
Sensor response time is a real performance parameter. A sensor that reacts in a couple of seconds flags a process upset while the excursion is still localized; a slow sensor reports the problem after the UPW loop has already circulated it to the tools. Faster detection shrinks the window in which a water quality excursion can reach production equipment.
Calibration and Maintenance Protocols
Effective resistivity monitoring requires regular calibration against certified reference standards. ASTM D1125 is the reference test method for water conductivity and resistivity measurement, and in semiconductor practice calibration intervals are commonly kept at 90 days or less for critical applications, with weekly verification checks using NIST-traceable conductivity standards.
Calibration involves comparing sensor readings against known conductivity values spanning the measurement range. For ultrapure water work, that typically means verification against 0.1 MΩ·cm (approximately 10 μS/cm) reference solutions at the low-resistance end, and matched-cell verification at the 18 MΩ·cm end (approximately 0.055 μS/cm)—standard solutions at ultrapure resistivity cannot be prepared and stored, so the high end is verified by in-line comparison rather than calibrated directly against a solution.
Maintenance considerations extend beyond calibration to sensor cleaning and replacement schedules. Biofilm accumulation on electrode surfaces skews readings substantially, which is why electrodes need periodic cleaning with ultrapure water and approved chemical agents. Many facilities run predictive maintenance programs using sensor response trend analysis to time interventions and skip unnecessary ones.
System Integration Considerations
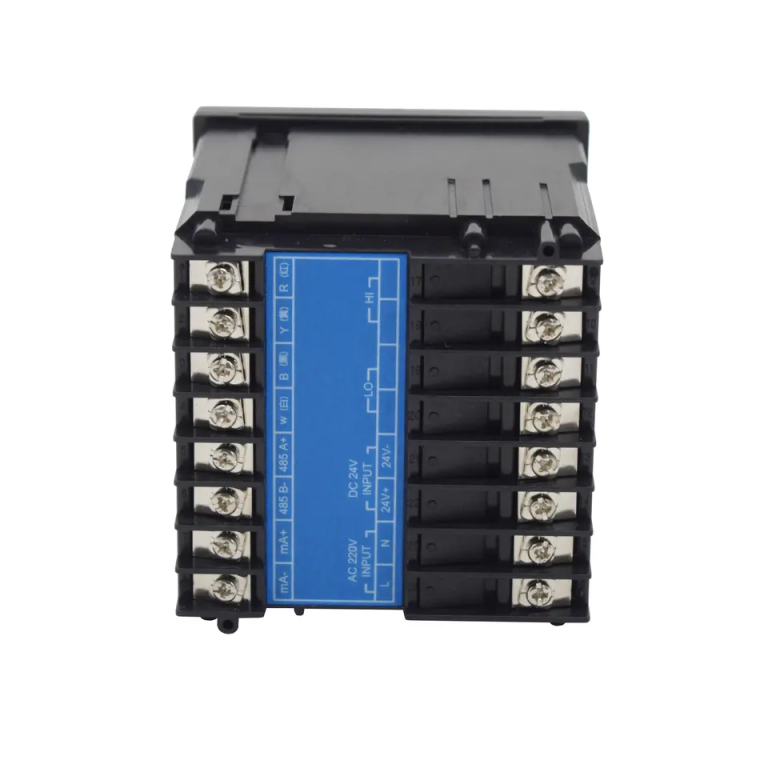
Resistivity monitoring systems must integrate with facility distributed control systems so that measurement deviations trigger automated responses. This integration typically uses 4-20 mA analog outputs for legacy systems or HART digital protocols for enhanced diagnostics and remote configuration.
Alarm configuration requires balance between sensitivity and specificity. Overly tight alarm limits generate nuisance alarms that desensitize operators; loose limits delay response to genuine quality excursions. Common practice keeps alarm deadbands around 2-3% of setpoint to prevent alarm chatter while responding quickly to significant deviations.
Data logging and trending provide the raw material for continuous improvement. Historical resistivity data enables correlation analysis with downstream quality metrics and root cause investigation when yield varies. Many facilities maintain resistivity data for 5 years or more to support retrospective analysis of long-term trends.
Quality Assurance Impact
Water quality excursions translate directly into manufacturing economics. Industry analyses attribute a meaningful share of device failures to water quality-related defects, with resistivity excursions among the recurring contributors.
Investment in high-quality resistivity monitoring pays back through several channels: fewer wafer defects, less unplanned system downtime, and optimized chemical consumption. Facilities that replace reactive maintenance with monitoring-driven programs report lower maintenance costs and fewer quality escapes.
The selection of resistivity monitoring technology requires evaluation of measurement accuracy, response time, integration capabilities, and total cost of ownership. Shanghai ChiMay provides technical consultation services to help facilities select monitoring configurations matched to their process requirements and quality objectives.