Traditional seawater desalination produces freshwater at USD 0.50–1.50 per cubic meter, and brine disposal takes a meaningful bite of that cost — commonly 5–15% of plant operating spend. Brine valorization is the discipline of turning that disposal line into revenue: concentrating the brine and recovering magnesium, calcium, gypsum, and other saleable products. For mid-sized facilities, a working valorization train can be worth a few million dollars a year, according to illustrative techno-economic modeling — a figure that depends heavily on brine chemistry and mineral prices. The desalination market behind it keeps expanding: Mordor Intelligence values the desalination systems market at USD 16.54 billion in 2025, reaching USD 25.34 billion by 2030 at an 8.91% CAGR. And measurement is what separates the models that work from the ones that stall — real-time salinity, conductivity, pH, ORP, turbidity, and flow data account for a small share of valorization capital but most of the controllable variance in recovery yield.
Every desalination plant board faces the same fundamental problem: freshwater production is expensive, and disposing of the brine byproduct adds insult to injury. With feedwater, energy, membrane replacement, and chemicals already scrutinized, brine disposal is the expense operators tolerate but cannot reduce — until now.
Brine valorization changes the frame: the brine stream becomes a feedstock whose dissolved magnesium, calcium, gypsum, and salts can be recovered and sold. For boards evaluating the transition, the question is increasingly about competitive positioning rather than optional innovation.
Table of Contents
The Current Economics of Desalination: A Cost-Only Model
Operating Cost Structure
As an illustrative order-of-magnitude model, a 50,000 m³/day seawater reverse osmosis (SWRO) plant carries an annual cost structure along these lines:
| Cost Category | Annual Cost (USD million) | % of Total |
|---|---|---|
| Energy (electricity for HP pumps) | 8–12 | 35–40% |
| Membrane replacement | 3–5 | 12–15% |
| Chemicals (antiscalant, cleaning, pretreatment) | 2–3 | 8–10% |
| Labor and maintenance | 3–4 | 10–12% |
| Brine disposal (diffuser, pumping, compliance) | 2–4 | 8–12% |
| Capital depreciation | 5–8 | 18–22% |
| Total | 23–36 | 100% |
The brine disposal line — a few million dollars a year — covers environmental compliance monitoring, diffuser maintenance, and regulatory reporting. It generates zero revenue, and it trends upward as discharge limits tighten across the EU, the Middle East, and Australia.
The Per-Cubic-Meter Problem
At USD 0.50–1.50 per cubic meter, desalinated water is the most expensive freshwater source in most markets, and municipal water tariffs often sit below the full cost of supply — which is why many plants run structurally at a loss, covered by government budgets or cross-subsidies.
This is the economic reality brine valorization can alter.
The Brine Valorization Model: Adding Revenue to the Equation
Revenue Streams
An illustrative valorization addition to an existing 50,000 m³/day plant can generate revenue along these lines:
| Recovered Product | Annual Production | Market Price | Annual Revenue (USD) |
|---|---|---|---|
| Magnesium hydroxide (high purity) | 300–1,000 tonnes | USD 2,000–4,000/tonne | 600,000–4,000,000 |
| Gypsum (construction grade) | 1,000–3,000 tonnes | USD 50–100/tonne | 50,000–300,000 |
| Mixed salts / other mineral products | site-dependent | site-dependent | site-dependent |
| Brine disposal cost avoided | — | — | 300,000–500,000 |
One line that does not belong in a revenue table — yet — is lithium. Seawater carries only about 0.17 mg/L of lithium, so even a 50,000 m³/day plant would hold roughly 3 tonnes of lithium (about 16 tonnes of lithium carbonate equivalent) per year at theoretical full recovery, and direct lithium extraction from seawater remains at pilot stage. Boards should treat lithium-from-desalination-brine as an option to watch, not a revenue line to bank.
Revised Economics
When valorization revenues are spread over the plant’s production volume:
- Without valorization: cost = USD 0.50–1.50/m³ (net expense)
- With valorization (conservative): revenue offset in the range of a few cents to a tenth of a dollar per cubic meter
- Net effective cost: meaningfully lower, with the exact figure set by brine chemistry and mineral markets
For plants with favorable brine chemistry and workable offtake agreements, the offset can bring the effective cost of desalinated water down toward municipal tariff levels. This is not a marginal improvement — it is a structural change to the desalination business model.
The Capital Requirement and Return Profile
Investment Scale
For a 50,000 m³/day plant, a complete brine valorization train requires, on an indicative basis:
| Component | Capital (USD million) |
|---|---|
| NF pre-concentration | 2–3 |
| MVR evaporator | 3–5 |
| Crystallization reactors | 2–4 |
| Mineral processing and packaging | 1–2 |
| Instrumentation and control | 0.3–0.5 |
| Engineering and commissioning | 1–2 |
| Total | 8–15 |
Return Metrics
| Metric | Conservative | Optimistic |
|---|---|---|
| Annual net operating income | USD 2.0 million | USD 5.0 million |
| Simple payback period | 5.0 years | 2.5 years |
| Internal rate of return (20-year) | 18% | 28% |
| Net present value (8% discount rate) | USD 8–12 million | USD 25–40 million |
These are model outputs, not promises — the spread between the columns is driven primarily by mineral prices, brine chemistry, and, more than anything else, the quality of process measurement and control.
The Critical Role of Real-Time Monitoring
Brine valorization is precision chemistry: at every stage from nanofiltration through crystallization, measurement accuracy feeds directly into recovery yield. In field practice, plants with full sensor coverage across the train run measurably better than plants relying on periodic manual checks — higher mineral recovery yields, fewer unplanned shutdowns from membrane or crystallizer fouling, lower reagent consumption through tighter pH/ORP control, and fewer measurement-related process upsets. The size of the gap varies by site, but the direction does not.
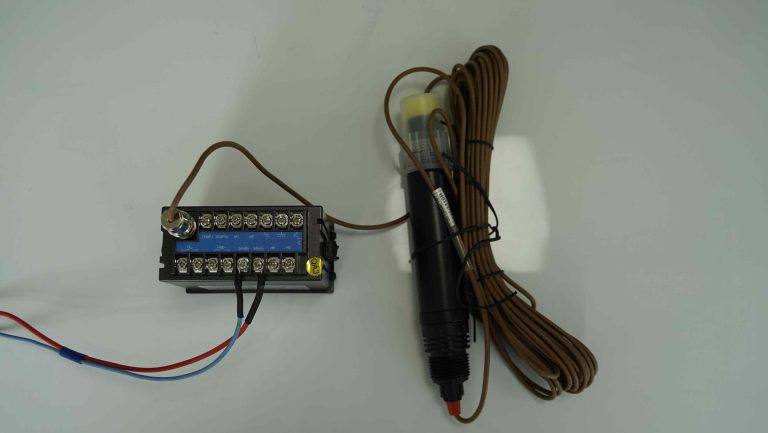
Shanghai ChiMay’s sensor platform for brine valorization covers the complete measurement set:
| Measurement | Sensor | Role in Recovery |
|---|---|---|
| Salinity / Conductivity | Salinity Digital Sensor, In-line Conductivity Meter | Brine concentration tracking, NF performance monitoring |
| pH | pH Electrode | Precipitation chemistry control (±0.2 pH unit windows) |
| ORP | ORP Sensor | Redox management for selective mineral recovery |
| Turbidity | Online Turbidity Tester | Membrane feed quality protection |
| Suspended Solids | SS Sensor | Crystallizer feed quality monitoring |
| Flow | Paddle Wheel / Turbine Flow Meter | Mass balance, pump efficiency, leak detection |
| Pretreatment | Softening and Filtering Valve | Crystallizer feed softening and particulate removal |
The instrumentation investment — a few hundred thousand dollars, on the order of 2–3% of total valorization capital — is what determines which column of the return table a plant lands in. In the illustrative model above, the payback on monitoring alone runs well under two years.
Board Decision Framework
For boards evaluating brine valorization, the key considerations are:
1. Does our brine chemistry support valorization?
Commission a brine characterization study to quantify recoverable mineral content. Not all brine sources are equally suitable — magnesium content, scaling tendency, and trace metal profiles vary widely by intake location and pretreatment configuration.
2. What is the regulatory trajectory for brine discharge?
Discharge rules in the EU, the Middle East, and Australia keep tightening and may make brine concentration mandatory in some jurisdictions. Early investment in valorization infrastructure puts the facility ahead of that curve.
3. What is the scale of the opportunity?
Run a techno-economic assessment with current mineral prices and conservative assumptions. If the conservative case still clears the hurdle rate, the project deserves a second look.
4. Is the instrumentation strategy adequate?
Make sure the project scope includes real-time monitoring at every critical measurement point. The monitoring investment is small against the capital total, and it is the single most important determinant of recovery performance.
Strategic Imperative
Brine valorization is moving from pilot projects to commercial deployments across the Middle East, Asia, and Australia, and the World Economic Forum’s June 2026 assessment of industrial water security placed brine mineral recovery among the five technology families reshaping the field. For boards, the question is not whether brine valorization becomes standard practice — it is whether your facility will be an early adopter or a late entrant. Shanghai ChiMay’s brine-rated sensor platforms provide the measurement foundation that determines whether recovery operations reach their modeled economics or fall short on monitoring gaps.