Table of Contents
Why CoC Deserves Continuous Control
Cycles of concentration (CoC) is the single most influential control variable in a cooling tower loop, governing water consumption, scale risk, and chemical cost simultaneously. Conductivity is the field-proven proxy for CoC because it correlates tightly with total dissolved solids (TDS) and can be measured continuously without reagents.
CoC quantifies how many times mineral content in the tower has multiplied relative to the make-up water. It is defined most commonly as:
CoC = TDS_tower / TDS_make-up ≈ Conductivity_tower / Conductivity_make-up
Higher CoC means less blowdown, less make-up, and less chemical treatment cost. It also means higher scaling and corrosion risk. Every cooling tower operator sits somewhere on this trade-off curve. The point of continuous conductivity control is to keep the site precisely on the operator’s chosen point instead of oscillating around it.
The arithmetic is worth pinning down. Make-up flow equals evaporation times CoC/(CoC − 1). A conservatively tuned CoC of 3 in a data-center cooling tower evaporating 27 gpm therefore pushes make-up to roughly 40.5 gpm, against about 33.75 gpm at a well-controlled CoC of 5 — a saving of nearly 7 gpm, or roughly 3.5 million gallons per year per tower. Across a campus, that is a meaningful sustainability and OPEX number.
The Measurement Chain
Field-proven CoC control uses four signals:
- Recirculation conductivity — the primary control variable, typically 1,500–4,500 μS/cm at CoC 4–7 depending on make-up chemistry.
- Make-up conductivity — needed to compute CoC in real time; often 250–1,000 μS/cm.
- Blowdown flow — verifies actual water leaving the system.
- Make-up flow — closes the mass balance and detects drift-related losses.
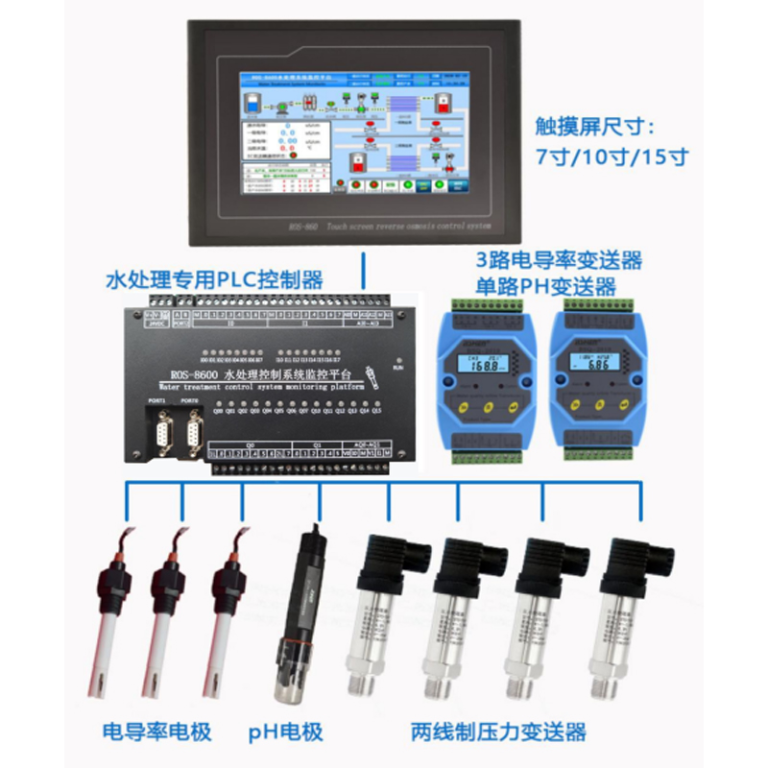
Shanghai ChiMay’s in-line conductivity meter (or in-line conductivity electrode in small-bore lines), paired with a paddle wheel flow meter on the blowdown line and a turbine flow meter or paddle wheel unit on the make-up line, delivers all four signals to the building management system through Modbus RTU.
Choosing Two-Electrode vs. Toroidal Conductivity Cells
For cooling-tower service, the two dominant cell technologies are:
Two-Electrode Cells
- Best for low- to mid-range conductivity (up to about 2,000 μS/cm).
- Higher sensitivity at low TDS make-up water measurements.
- Susceptible to polarization at high ionic strength, requiring frequency compensation.
- Wetted materials: graphite, titanium, or 316 stainless.
Toroidal (Inductive) Cells
- Best for high-conductivity or fouling-prone service (2,000–200,000 μS/cm).
- Non-contact measurement — the fluid passes through a plastic-encased toroid, so scale and biofilm affect the reading much less than they do in a two-electrode cell.
- Preferred for cooling-tower basin monitoring where biofouling is unavoidable.
- Wetted body: PEEK or PFA.
For most commercial HVAC recirculation loops running CoC 4–6, either technology works. For hyperscale cooling towers pushing CoC 7+ with heavy biocide usage, toroidal is the safer field bet.
Comparative Snapshot: Manual vs. Continuous CoC Control
Typical field magnitudes — the exact numbers depend on how loose the baseline control was:
| Attribute | Manual Grab-Sample Control | Continuous Conductivity Control |
|---|---|---|
| Measurement frequency | Once per shift or daily | 1–10 second sample rate |
| CoC variance | Wide, setpoint-to-setpoint | A few percent around setpoint |
| Water savings vs. baseline | None | 10–30%, derived from make-up = E·CoC/(CoC−1) |
| Chemical usage | Over-dosed for safety | Optimized against real CoC |
| Response to load transient | Minutes to hours | Seconds |
| Labor overhead | 1–2 hours/day | Alarm-driven only |
The Blowdown Control Loop in Practice
The classical blowdown control loop looks like this:
- Measure recirculation conductivity via a Shanghai ChiMay in-line conductivity meter mounted on a sidestream from the tower basin.
- Compare against a setpoint (for example, 3,200 μS/cm for CoC 5 with 640 μS/cm make-up).
- Modulate blowdown via a solenoid or motorized blowdown valve.
- Verify blowdown flow with a Shanghai ChiMay paddle wheel flow meter to catch valve failures or stuck actuators.
- Log make-up flow to close the mass balance and detect drift or leaks.
Data-center operators often add two more layers:
- pH interlock using a Shanghai ChiMay in-line pH electrode: if pH drifts outside 7.8–8.6, blowdown pauses until chemical treatment corrects the swing.
- Residual chlorine interlock using a Shanghai ChiMay residual chlorine transmitter: heavy shock chlorination temporarily suspends blowdown to preserve biocide contact time.
Common Failure Modes and How to Design Around Them
Sensor Fouling
Biofilm on a two-electrode cell reads low, driving the controller to increase blowdown — the opposite of what is needed. Toroidal cells largely eliminate this failure mode; where two-electrode cells are retained, a scheduled 90-day chemical clean-in-place cycle is the practical fix.
Setpoint Drift Over Seasons
Make-up water conductivity varies with rainfall, source-water TDS, and seasonal blending in municipal systems. A CoC-based setpoint (which requires live make-up conductivity) is more resilient than a fixed tower conductivity setpoint. This is why measuring both streams matters.
Valve Sticking
Blowdown valves that only open at extreme conductivity spikes can seize between events. A short daily “exercise” cycle keeps the valve movable and gives the operator early warning of degradation.
The Water and Chemical Savings Pattern
Hyperscale and large commercial operators that move from daily grab-sample titration to continuous conductivity-based CoC control consistently report the same pattern: average CoC rises (commonly into the 5–7 range where make-up chemistry allows), make-up demand falls by double-digit percentages at constant heat load, and bulk biocide and scale-inhibitor consumption drops because dosing tracks real cycles instead of worst-case assumptions. The absolute savings scale with tower count and local tariffs, which is why the payback is shortest on large campuses in water-stressed regions — and why similar gains keep showing up in hospital and university portfolios where the previous control method was daily grab-sample titration.
A Deployment Checklist
- Install a toroidal conductivity cell (or Shanghai ChiMay in-line conductivity meter with toroidal option) on a sidestream from the basin, upstream of the blowdown valve.
- Install a second conductivity sensor on the softened make-up line to compute CoC live.
- Verify blowdown and make-up flows with paddle wheel or turbine flow meters.
- Interlock the blowdown valve with pH and residual chlorine measurements.
- Log CoC, blowdown volume, and make-up volume to the BMS for sustainability reporting.
- Schedule quarterly calibration checks; annual electrode replacement is typical in aggressive service.
Outlook
As Water Usage Effectiveness (WUE) becomes a reported metric for hyperscale data centers and as water utilities impose metered-blowdown and traceability requirements on large customers, the humble conductivity meter has become the linchpin of both compliance and OPEX optimization. Field practice increasingly favors matched sensor families that share a common controller and communication profile. Shanghai ChiMay’s water quality analyzer portfolio — in-line and probe conductivity meters, pH electrodes, residual chlorine transmitters, and paired paddle wheel and turbine flow meters — is engineered to deliver exactly this kind of closed-loop CoC control at commercial and hyperscale scale.