Short answer:
- Continuous monitoring does not replace laboratory compliance testing. It fills the time between samples and shortens the period during which a problem can spread.
- The parameters worth monitoring continuously are the ones that move fast: chlorine residual, turbidity, pH, conductivity, and dissolved oxygen.
- Economics come from chemical control, leak and loss detection, and fewer emergency callouts, not from a single headline saving.
- Sensors fail and drift. A monitoring program is only as good as its calibration and verification discipline.
Municipal water management faces compounding pressures: aging distribution systems, growing urban populations, and tightening regulation. Real-time water quality monitoring has become a core technology for utilities that need to protect public health while keeping operating costs under control.
Table of Contents
The Shift from Periodic to Continuous Monitoring
Traditional water quality management relied on periodic sampling: collect at fixed locations, send to the laboratory, wait for results. The approach is accurate and legally defensible, but it samples a moving target. Sampling intervals can span days or weeks, and conditions have usually changed by the time results arrive.
Continuous monitoring closes that gap with permanently installed sensors measuring critical parameters around the clock. The shift is more than a technology upgrade. It changes how utilities see and respond to water quality events, and it moves the lab from sole detector to confirmation role.
The U.S. Environmental Protection Agency (EPA) sets the treatment and monitoring framework utilities operate within, and continuous monitoring helps utilities meet it by documenting conditions between required samples. Early warning is particularly valuable for disinfection byproducts (DBPs), which form when disinfectants react with organic matter and which respond to changes in source water quality that a periodic sample can miss.
Critical Parameters in Municipal Water Quality Monitoring
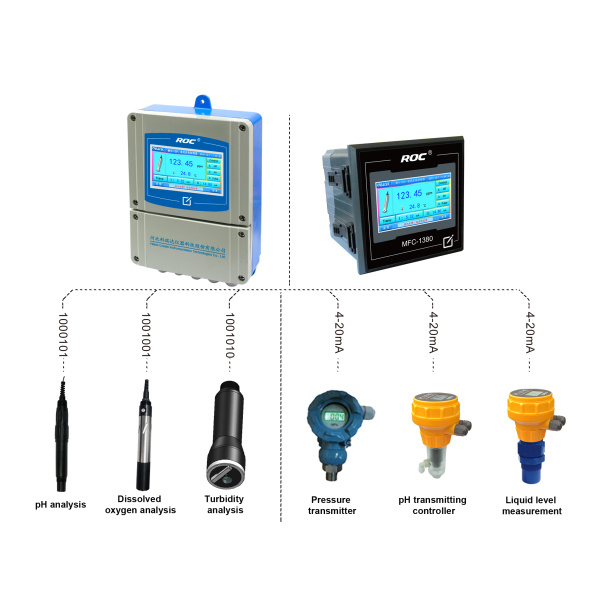
Effective programs track several indicators at once. pH sensors measure acidity, which drives pipe corrosion and metal leaching. Dissolved oxygen (DO) analyzers indicate biological activity and potential contamination in storage and distribution. Turbidity sensors detect suspended particles that can shelter pathogens.
Residual chlorine transmitters verify disinfection throughout the distribution system. EPA sets a maximum residual disinfectant level of 4.0 mg/L for chlorine (40 CFR 141.65) to limit DBP formation, and utilities typically target a free chlorine residual of at least 0.2 mg/L at the far ends of the system to keep disinfection effective. Continuous measurement lets operators hold that band deliberately instead of discovering a residual problem after a bacteriological result comes back.
Conductivity sensors act as an early warning for intrusion and cross-connections. Drinking water conductivity commonly falls in the range of roughly 50-800 μS/cm depending on mineral content. A step change in conductivity, especially one that moves in the opposite direction to the network’s normal pattern, is worth an investigation even when no other parameter has moved yet.
Shanghai ChiMay provides inline water quality sensors for continuous municipal monitoring, built for the accuracy and stability that regulatory programs require.
Economic Benefits of Continuous Monitoring
The financial case extends past compliance. Utilities generally find savings in three places:
- Chemical control: dosing trimmed against measured residual and demand rather than conservative fixed rates
- Loss detection: pressure and flow anomalies surfaced earlier, which shortens leak run time
- Reduced emergency response: fewer after-hours callouts and fewer boil-water events when anomalies are caught in the network rather than in customer complaints
Payback depends heavily on system size and on how much manual sampling and laboratory work the utility can genuinely reduce. Utilities that keep sampling frequencies unchanged after installing sensors do not see the labour benefit, and they should not expect it.
Regulatory Compliance and Reporting
Municipal systems operate under increasingly detailed water quality rules. The Safe Drinking Water Act (SDWA) requires monitoring of numerous contaminants at prescribed frequencies, and continuous monitoring simplifies compliance by producing the detailed records regulators expect.
Modern systems log every measurement automatically, which creates an audit trail for review and reduces staff time spent assembling reports. Regulators have responded positively to utilities that can show data between required samples, and several states offer flexibility to systems with demonstrated continuous monitoring programs.
The European Union’s Drinking Water Directive (EU) 2020/2184 goes further, requiring risk-based assessment of the whole supply chain from catchment to tap. A risk-based approach needs continuous data about where quality actually varies, which is exactly what fixed-interval sampling struggles to provide. Utilities worldwide are treating continuous monitoring as an operational requirement rather than an optional upgrade.
Implementation Considerations
Utilities evaluating continuous monitoring should work through several questions before buying anything.
Where does the data need to come from? Sensor placement should follow distribution hydraulics. Priority points are treatment plant effluent, entry points to the distribution system, storage facilities (particularly their outlets), and areas with a history of water quality complaints or low residual. A sensor in a dead leg measures water nobody drinks.
What maintenance can the utility sustain? Turbidity sensors in surface water service typically need weekly cleaning; pH electrodes need regular calibration. Self-cleaning mechanisms and automated calibration verification reduce the burden but do not remove it. Maintenance labour is the cost that utilities most often underestimate.
Who is going to look at the data? Continuous monitoring produces a large volume of readings. Utilities need a data management approach that stores, validates, and presents the information, plus clear alarm thresholds and an on-call response plan. Data without a response plan generates complaints internally and changes nothing externally.
Future Directions
Artificial intelligence and machine learning are entering municipal practice, mostly for predictive modeling: anticipating water quality changes from rainfall, source water shifts, and network operations, so utilities can act before a threshold is crossed.
Advanced sensor development will extend what can be measured continuously. Instruments for specific pathogens, pharmaceutical residues, and other emerging contaminants are progressing, though most are not yet ready for routine distribution system deployment.
Smart water networks, the integration of continuous monitoring with automated control and analytics, promise further gains. The utilities reporting the best results are the ones that treat monitoring data as an input to operations rather than as a compliance deliverable.
Real-time water quality monitoring has moved from experimental technology to essential infrastructure for progressive utilities. As sensor costs decline and analytics improve, continuous monitoring will become the default approach for municipal water quality management.