Produced water discharge is one of the more tightly regulated activities in oil and gas production, and it is also one where the rules are frequently summarised incorrectly. The limits differ in kind as well as in value — one framework sets an average performance standard, another sets a daily maximum and a 30-day average, a third applies to ships rather than platforms — and the monitoring implications of those differences are not the same.
This guide sets out what each framework actually requires, what it means for instrumentation, and how to build a compliance programme that holds up.
Table of Contents
Understanding International Discharge Standards
OSPAR: North Sea and Northeast Atlantic
For offshore installations in the OSPAR maritime area, the controlling instrument is OSPAR Recommendation 2001/1 on the management of produced water from offshore installations. It sets a performance standard of 30 mg/L dispersed oil in produced water, with the stated objective of reducing discharges toward 15 mg/L, and it requires annual reporting of discharge volumes and oil content by installation.
Points that are commonly wrong in secondary summaries:
- It is a recommendation (2001/1), not a decision. The older OSPAR Decision 2000/2 concerned organic-phase drilling fluids and cuttings, not produced water
- It is an average-based performance standard, not a daily maximum limit. There is no 100 mg/L daily ceiling in the recommendation
- Member states implement it through national permitting: the Norwegian Environment Agency (which took over the functions of the former SFT) and the UK’s Offshore Petroleum Regulator for Environment and Decommissioning (OPRED) enforce through permits and inspection
Because the standard is average-based, demonstrating compliance requires a measurement record across the reporting period. Grab samples taken occasionally cannot show an average, which is the fundamental reason continuous monitoring is standard practice on North Sea platforms for oil-in-water measurement.
EPA: US Waters Under NPDES
In the United States, produced water discharge is permitted under the Clean Water Act’s National Pollutant Discharge Elimination System, with effluent limits derived from the Oil and Gas Extraction Effluent Guidelines at 40 CFR Part 435.
For the offshore subcategory (Subpart A), the oil and grease limits are well established:
- 42 mg/L maximum for any one day
- 29 mg/L as an average of daily values for 30 consecutive days
These are applied through the NPDES general permit for the offshore subcategory, and they are the numbers a Gulf of Mexico platform is actually measured against. Note the structure: a daily maximum and a 30-day average, which means both a short excursion and a sustained drift can put an operator out of compliance. Onshore discharges are permitted under different subcategories and frequently with site-specific limits, so they need to be read from the permit rather than assumed.
MARPOL Annex I
MARPOL Annex I regulates oil discharges from ships. The 15 ppm limit, the requirement to be more than 12 nautical miles from land, and the “en route with monitoring in operation” condition belong to machinery space oily water discharges; for vessels of 400 gross tonnage and above, an oil filtering and monitoring system with an alarm and automatic stopping device is required.
Fixed and floating offshore platforms fall under Annex I Regulation 39, which requires them to comply with the discharge requirements of the coastal state rather than with the ship discharge provisions. For a North Sea platform, that means OSPAR; for a Gulf of Mexico platform, 40 CFR 435 and the NPDES permit. Quoting the 15 ppm ship limit as the platform produced water limit is a common and consequential error.
Produced Water Characteristics and Compliance Challenges
Understanding the Discharge Stream
Oil concentration variability: below 50 mg/L in mature waterflooded fields, and above 10,000 mg/L in primary production from some formations. Treatment design has to handle the upper end and still perform at the lower end, which is a wide operating envelope.
Emulsification: stable oil-in-water emulsions resist gravity separation. Chemical destabilisation and more intensive separation are required, which is a design consideration rather than a monitoring one — but the treatment chemical programme affects the fluorescence response of online analysers, which is why calibration is checked after chemical changes.
Flow variability: production rates and water cuts change with well performance, and compliance calculations depend on flow-weighted averaging.
Formation chemistry evolution: as fields mature, produced water composition shifts. Regular characterisation keeps treatment design valid and keeps the monitoring programme correctly specified.
Interpreting the Limits
Average-based limits require flow-weighted averaging across the reporting period, which means the monitoring system has to record concentration and flow together. Without flow data, an average cannot be demonstrated.
Daily maximum limits apply to a single day’s value and are breached by a short excursion — which is the strongest argument for continuous measurement rather than once-per-shift sampling.
Reference methods: compliance is assessed against laboratory methods — ISO 9377-2 (hydrocarbon oil index, solvent extraction with GC-FID), ASTM D7066 (infrared determination) and EPA Method 1664 (oil and grease by hexane extraction). Online instruments such as UV fluorescence analysers correlate with these methods after site-specific calibration; they do not replace them for regulatory determination.
Treatment Technologies
| Technology | Typical oil removal | Capital | Operating cost | Footprint |
|---|---|---|---|---|
| Gravity separator (API) | 50–70% | Low | Very low | Large |
| Induced gas flotation (IGF) | 70–90% | Moderate | Moderate | Moderate |
| Hydrocyclone | 60–80% | Low | Low | Small |
| Media filtration | 80–95% | Moderate | Moderate | Moderate |
| Membrane (UF/NF) | 95–99% | High | Higher | Small |
The usual offshore configuration is hydrocyclone plus IGF with a degassing unit; media filtration and membranes appear where produced water quality has to meet a tighter specification, or onshore where reuse is the objective. No single stage achieves the limit on its own — the train does.
Monitoring Requirements and Best Practices
Continuous vs. Periodic Monitoring
Periodic sampling provides independent verification with full laboratory method compliance, but it takes days to return a result and cannot detect a short excursion.
Continuous inline monitoring provides real-time measurement with alarm and diversion capability. This is what makes it possible to act while the discharge is still within limits rather than after the fact.
In practice both are used: continuous instruments for control and early warning, laboratory reference analysis for compliance determination and for validating the correlation between the analyser and the reference method.
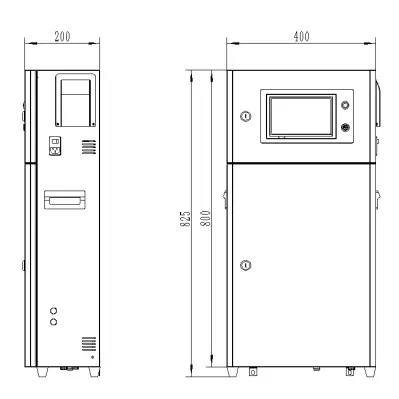
ChiMay online analysers measure oil-in-water continuously by UV fluorescence, with the calibration and correlation work against ISO 9377-2 or the applicable reference method carried out for the site’s specific oil.
Monitoring System Design
- Primary sensor: oil-in-water at final discharge — UV fluorescence for the low-concentration discharge range, infrared absorption for higher-concentration monitoring duty
- Flow measurement: required for flow-weighted averaging and load calculation
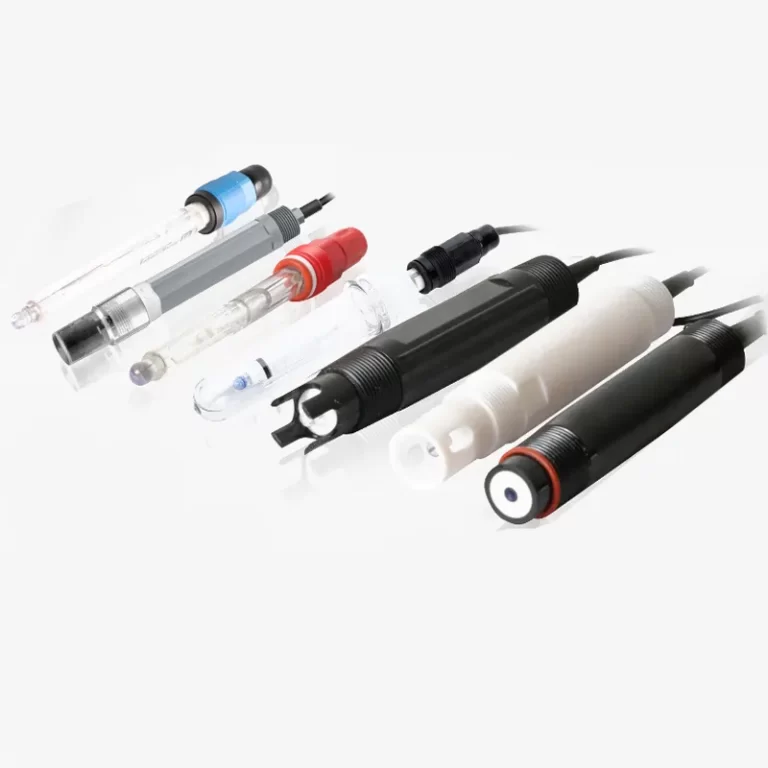
- Process sensors: conductivity, pH and turbidity for treatment train performance
- Redundancy: backup measurement on the discharge point where the permit requires continuous data availability
- Data management: secure storage, alarm notification, and reporting in the format the regulator requires
Calibration and Quality Assurance
Quality assurance is what makes continuous data defensible:
- Daily checks on critical instruments, against a known standard or by verification against the reference method
- Weekly zero and span verification to confirm the sensor is responding
- Monthly laboratory correlation comparing the analyser against the reference method on the same water
- Quarterly calibration to manufacturer procedure
- Annual recertification by qualified instrumentation personnel
ChiMay service programmes support this schedule with calibration services and documentation.
Compliance Documentation and Reporting
Recordkeeping
Permits typically require retention of:
- Discharge volumes and flow rates
- Oil concentration measurements, continuous and reference
- Treatment system operating parameters
- Maintenance and calibration records for the monitoring equipment
- Non-compliance events with the corrective action taken
- Laboratory analysis results and chain of custody
The records that cause problems in an audit are almost always the calibration and maintenance ones, not the concentration data.
Reporting
- Monthly operating reports covering discharge volumes and concentrations (in the United States, the Discharge Monitoring Report)
- Quarterly compliance certifications where the permit requires them
- Annual reporting of discharge volumes and oil content per installation, as OSPAR requires
- Incident reports for any non-permitted discharge
Audit Readiness
- Documented SOPs for treatment and monitoring operations
- Operator training records
- Equipment maintenance logs showing preventive maintenance was performed
- Corrective action records for every identified deficiency
Conclusion
Produced water discharge compliance comes down to knowing which limit applies and how it is measured: OSPAR’s 30 mg/L performance standard for North Sea platforms, the 42 mg/L daily maximum and 29 mg/L 30-day average under 40 CFR 435 for US offshore operations, and the MARPOL 15 ppm limit for the ship discharges it actually covers. Average-based limits require continuous data and flow integration; daily maximum limits require instrumentation that reacts while the event is happening. Operators that combine a properly configured treatment train with continuous measurement and a disciplined calibration programme satisfy both. ChiMay’s oil-in-water analysers and multi-parameter instruments provide the measurement layer.