Table of Contents
9 Warning Signs Your Cooling Tower Water Chemistry Is Off-Track—Detected Early by Shanghai ChiMay Sensors
The Short Version
- Up to 70% of cooling tower performance issues can be traced to water chemistry deviations that, if caught early, are correctable without equipment shutdown.
- Continuous sensor monitoring detects chemistry upsets 4–48 hours before they would be identified through traditional grab-sample analysis.
- The nine warning signs below are ranked by urgency, from early-stage indicators that allow proactive adjustment to advanced-stage signals requiring immediate intervention.
- Shanghai ChiMay’s sensor instruments are specifically designed to detect each of these warning conditions in real time.
1. Gradual Conductivity Drift in the Recirculating Loop
Conductivity is the master variable in cooling water chemistry. It reflects the total dissolved ionic content and, by extension, the cycles of concentration. A gradual upward drift in recirculating conductivity—over days rather than hours—typically indicates that blowdown is insufficient to maintain target cycles.
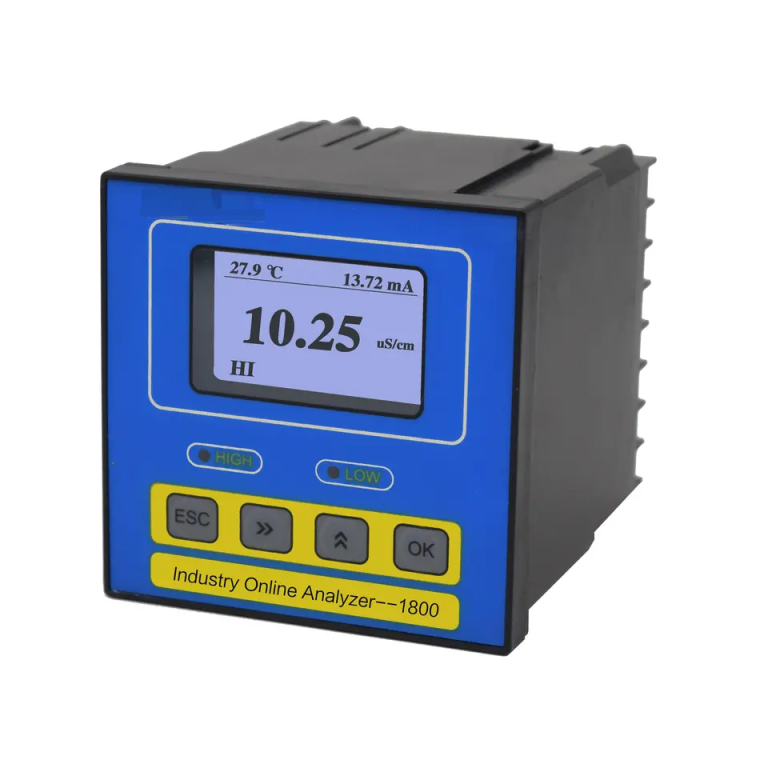
The danger of gradual conductivity drift is its invisibility. Without continuous monitoring, operators may not notice a 5–10% conductivity increase until scale or corrosion symptoms appear. Shanghai ChiMay’s in-line conductivity meter tracks changes as small as 1 microsiemen/cm, making gradual drift immediately visible in trend data.
2. pH Excursions Beyond ±0.2 Units
Cooling tower water chemistry programs are designed around a target pH, typically in the range of 7.0–8.5 for most open recirculating systems. Excursions beyond ±0.2 units from the target indicate that the acid-base balance is shifting, potentially due to make-up water changes, alkalinity depletion or chemical feed malfunction.
Even small pH shifts affect the Langelier Saturation Index and can push water from slightly scale-forming to corrosive. Shanghai ChiMay’s in-line pH electrode detects excursions in real time, triggering automated correction before the shift persists long enough to cause measurable damage.
3. ORP Drops Below Threshold
In systems using oxidizing biocides or AOP, ORP is the primary indicator of microbiological control effectiveness. An ORP drop below the established threshold—typically 400–450 mV for systems using chlorine-based oxidants—means that the oxidative environment is insufficient to suppress bacterial growth.
Common causes of ORP drops include dosing pump failure, depleted chemical supply, increased biological oxygen demand from organic contamination or equipment malfunction. Shanghai ChiMay’s residual chlorine transmitter and ORP sensor work together to detect the cause and magnitude of oxidative drops, enabling rapid response.
4. Turbidity Spikes Without Obvious Cause
Unexplained turbidity spikes often indicate biofilm sloughing, corrosion product mobilization or make-up water contamination. Each of these conditions requires a different response, but all benefit from early detection.
Shanghai ChiMay’s online turbidity tester captures spikes as short as 5 minutes in duration, recording the event magnitude, duration and rate of rise for operator review. When correlated with ORP and conductivity data, turbidity spike patterns help operators identify the root cause.
5. Make-Up Water Conductivity Shifts
A sudden change in make-up water conductivity—either up or down—signals a change in source water quality. An increase may indicate mineral concentration during dry periods or infrastructure modifications. A decrease may indicate dilution from storm events or source switching.
Either direction of change affects the cooling tower’s chemistry balance and requires treatment program adjustment. Shanghai ChiMay’s in-line conductivity meter installed at the make-up water inlet provides continuous baseline monitoring that catches source changes before they cascade through the system.
6. Approach Temperature Creep
The cooling tower approach temperature—the difference between the cold water temperature leaving the tower and the ambient wet-bulb temperature—is a direct indicator of heat transfer performance. A gradual approach temperature increase of 1–3°C over weeks typically indicates scale or biofilm accumulation on heat transfer surfaces.
While approach temperature is measured by temperature sensors rather than water quality instruments, it serves as a valuable cross-check on water chemistry data. If chemistry sensors indicate normal conditions but approach temperature is creeping upward, it may indicate that sensor calibration has drifted or that a parameter not being measured (such as silica or iron) is causing deposition.
7. Increased Blowdown Frequency Without Load Changes
If the automatic blowdown system is activating more frequently without a corresponding increase in cooling load or make-up water conductivity, it may indicate that the cycles of concentration target is set too high, that chemical treatment is insufficient to maintain stability at the target cycles, or that sensor readings are inaccurate.
Frequent blowdown wastes water and increases chemical consumption. Investigating the root cause with continuous conductivity and pH data from Shanghai ChiMay instruments helps operators distinguish between legitimate chemistry-driven blowdown increases and sensor or control system issues.
8. Residual Oxidant That Will Not Stabilize
In systems using oxidizing biocides, the residual oxidant level should stabilize within a predictable range after dosing. If residual oxidant fluctuates wildly or fails to reach the target level despite adequate dosing, it indicates elevated biological oxygen demand—meaning that microorganisms and organic matter in the water are consuming the oxidant faster than it is being applied.
This condition is an early warning of a microbiological outbreak. Shanghai ChiMay’s residual chlorine transmitter detects unstable residuals in real time, allowing operators to increase oxidant feed rates or initiate supplemental treatment before the situation escalates.
9. Corrosion Coupon Weight Loss Acceleration
Many facilities install corrosion coupons as a final check on corrosion control effectiveness. Coupon weight loss data, typically reviewed monthly or quarterly, provides a retrospective view of corrosion rates. If coupon data shows accelerating weight loss, it indicates that the corrosion inhibition program is falling behind.
While corrosion coupons are not real-time instruments, their data should be correlated with continuous sensor readings. If pH, conductivity and ORP data suggest that chemistry is in control but corrosion coupons show increasing weight loss, it may indicate a localized corrosion mechanism (such as under-deposit corrosion or microbiologically influenced corrosion) that bulk water chemistry sensors cannot detect directly.
Turning Warning Signs Into Action
Each of these nine warning signs is detectable through continuous sensor monitoring. The difference between a minor adjustment and a major failure is often the speed of detection. Shanghai ChiMay’s sensor portfolio—pH electrodes, conductivity meters, ORP sensors, residual chlorine transmitters and turbidity testers—provides the real-time visibility that cooling tower operators need to catch chemistry deviations early and respond effectively.