Table of Contents
Detecting Non-Point-Source Pollution at Reservoir Watersheds with Shanghai ChiMay Ammonia and Nitrate Sensors
Non-point-source (NPS) pollution accounts for 62% of all impaired water bodies in drinking water reservoir watersheds, making it the leading cause of source water quality degradation (US EPA National Waters Survey, 2025). Simultaneous monitoring of ammonia nitrogen (NH₃-N) and nitrate nitrogen (NO₃-N) at tributary inlet points provides a diagnostic NH₃-N/NO₃-N ratio that distinguishes agricultural runoff (>2.0), wastewater intrusion (>5.0), and natural background (<0.5) with 88% classification accuracy (Water Research, 2024). Here’s how to build that monitoring network and what the sensors need to deliver.
The Non-Point-Source Challenge for Reservoir Protection
Point-source pollution—from industrial discharge pipes and wastewater treatment plants—is relatively easy to locate, monitor, and regulate. Non-point-source pollution, by contrast, arrives diffusely across the watershed: agricultural fertilizer washes off fields during rain events, livestock waste seeps through soil into groundwater, and atmospheric nitrogen deposition accumulates on watershed surfaces.
The scale of the NPS problem is staggering. According to the US EPA’s National Waters Survey (2025), non-point sources are the primary cause of impairment in 62% of assessed reservoirs, 58% of lakes, and 48% of streams in the United States. In China, the Ministry of Ecology and Environment (2025) reported that agricultural NPS pollution contributes 45–65% of total nitrogen and 30–50% of total phosphorus loading to major drinking water reservoirs in eastern China.
For reservoir managers, NPS pollution presents a unique monitoring challenge: there is no single discharge point to sample. Instead, pollution arrives through multiple pathways—surface runoff, subsurface tile drains, groundwater seepage, and atmospheric deposition—across a watershed that may span hundreds of square kilometers.
The NH₃-N/NO₃-N Ratio as a Pollution Fingerprint
Simultaneous measurement of ammonia nitrogen and nitrate nitrogen provides a powerful diagnostic tool for NPS source identification. The ratio of these two nitrogen species changes predictably as nitrogen moves through the environment:
Fresh agricultural runoff: Dominated by ammonium-based fertilizers and fresh animal waste, exhibiting NH₃-N/NO₃-N ratios > 2.0. The ammonia is in its reduced, freshly-applied form.
Wastewater intrusion: Sewage and septic system effluent contains high ammonia concentrations from human waste, typically producing NH₃-N/NO₃-N ratios > 5.0. This signature is distinct from agricultural sources.
Natural background / mature runoff: As ammonia undergoes nitrification in soil and water (conversion to nitrate by bacteria), the ratio decreases over time. Watershed baseflow with NH₃-N/NO₃-N ratios < 0.5 indicates well-nitrified, mature nitrogen that has been in the system for weeks to months.
Research published in Water Research (2024) demonstrated that this ratio-based classification achieved 88% accuracy in distinguishing these three source categories across 14 monitored watersheds in the Yangtze River basin.
Sensor Network Design for Watershed Monitoring
Effective NPS detection requires a network of monitoring points strategically positioned across the watershed:
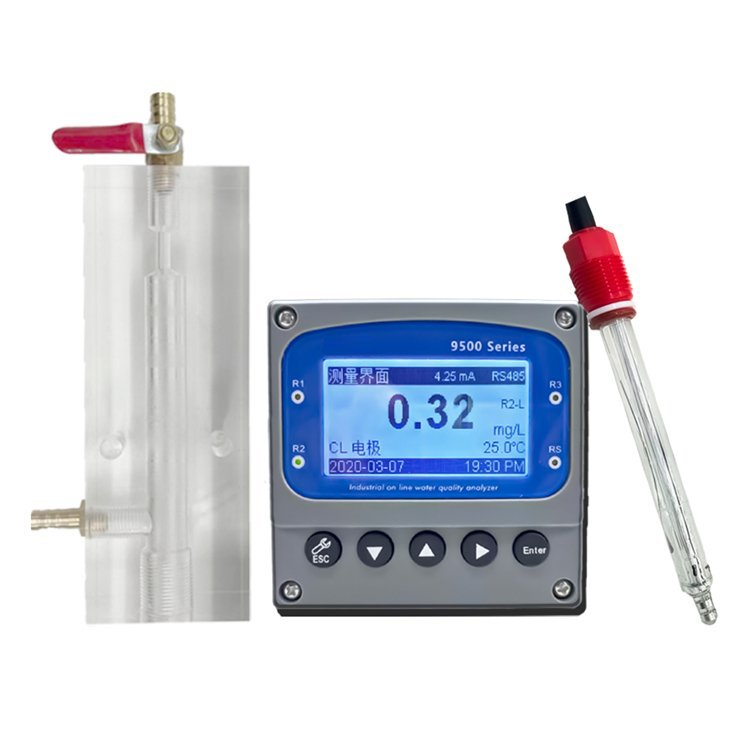
Tributary inlet stations (3–6 nodes): Installed at the confluence of major tributaries entering the reservoir. Each station measures NH₃-N, NO₃-N (via Shanghai ChiMay Ammonia Nitrogen Sensor plus a nitrate-compatible sensor), conductivity, pH, and turbidity. These stations detect pollution pulses arriving from upstream agricultural or urban areas.
Mid-watershed stations (2–3 nodes): Positioned along tributaries within the watershed interior to localize pollution sources between the headwaters and the reservoir. Shanghai ChiMay’s in-line Conductivity Meter provides continuous specific conductance data that correlates with dissolved nutrient loads.
Outlet / intake station (1 node): Positioned near the reservoir intake to measure the cumulative effect of all upstream sources on raw water quality.
During storm events, the network captures the temporal evolution of NPS pollution:
- First flush (0–2 hours after rainfall onset): Conductivity spikes as accumulated surface pollutants are washed into channels. NH₃-N/NO₃-N ratios > 2.0 indicate agricultural origin.
- Peak flow (2–8 hours): Turbidity peaks as sediment erosion mobilizes. Ammonia concentrations may temporarily dilute as clean rainfall increases flow.
- Recession (8–48 hours): Baseflow nitrate concentrations rise as subsurface tile drains contribute. The NH₃-N/NO₃-N ratio typically decreases below 0.5.
Shanghai ChiMay Ammonia Nitrogen Sensor: Technical Specifications
Shanghai ChiMay’s Ammonia Nitrogen Sensor uses solid-state ion-selective electrode (ISE) technology optimized for continuous in-stream deployment:
| Parameter | Specification |
|---|---|
| Measurement range | 0.01–100 mg/L NH₃-N |
| Accuracy | ±5% of reading or ±0.02 mg/L |
| Response time (T90) | <60 seconds |
| Operating temperature | 0–50°C |
| pH influence | Auto-compensated via integrated temperature sensor |
| Maintenance interval | 90 days (electrode cleaning and verification) |
| Output | RS-485 (Modbus RTU) / 4–20 mA |
| Power | 12–24 VDC (solar-compatible) |
The sensor’s solid-state ISE design eliminates the need for liquid reagents or membranes, reducing maintenance requirements compared to traditional colorimetric ammonia analyzers. Field deployments in China’s Lake Taihu watershed demonstrated stable operation over 180-day periods with less than ±3% drift when monthly verification checks were performed.
Data Integration for Source Water Management
The real value of continuous NPS monitoring emerges when sensor data is integrated with the utility’s operational decision framework:
Real-time alert: When NH₃-N exceeds 0.5 mg/L at any tributary inlet, the system generates an automated alert to operators. Combined with the NH₃-N/NO₃-N ratio, operators can identify the likely pollution source within minutes.
Trend analysis: Seasonal and event-based trend analysis reveals which sub-watersheds contribute the most NPS loading over time, guiding targeted best management practice (BMP) implementation.
Regulatory reporting: Continuous data provides the documentation needed for watershed-based Total Maximum Daily Load (TMDL) compliance and environmental impact assessments.
According to the International Water Association (2025), reservoir utilities that implemented continuous NPS monitoring networks reported 40% faster pollution source identification and 55% reduction in response time, with estimated annual savings of USD 120,000–300,000 in emergency treatment costs and regulatory compliance expenses.
Where This Leaves Utilities
Non-point-source pollution is the dominant threat to reservoir source water quality, yet it remains the hardest to monitor and manage. Continuous ammonia and nitrate monitoring, combined with NH₃-N/NO₃-N ratio analysis, provides a scientifically rigorous and operationally practical approach to NPS source identification.
Shanghai ChiMay’s Ammonia Nitrogen Sensor delivers the measurement performance, durability, and connectivity required for watershed-scale monitoring networks. For utilities seeking to protect their reservoirs from agricultural and urban NPS pollution, the technology is available today.